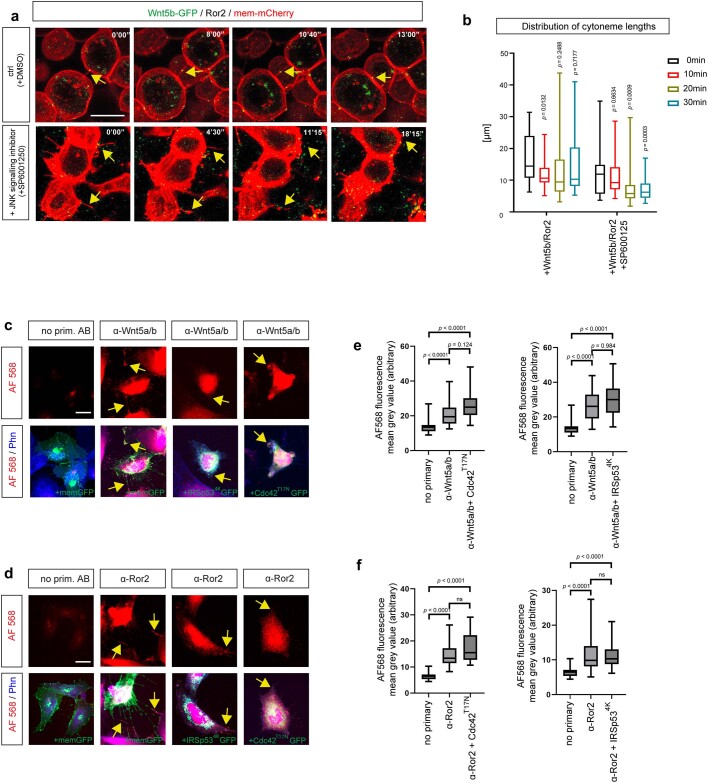
Extended Data Fig. 5. Cytoneme modulators for Wnt5b/Ror2 transport.
a. Time series of cytonemes in wild-type zebrafish embryos. Embryos were injected with Wnt5b-GFP/Ror2/mem-mCherry in the clone. At 6hpf, the embryos were treated with DMSO or JNK inhibitor SP600125 from 0’00” to 35’00” and imaged live. Yellow arrows indicate the retraction of cytonemes at the corresponding time points. b. The quantitative analysis of cytoneme length at the different time points in zebrafish embryos was treated as indicated in (a). (Wnt5b/Ror2: n = 25, 23, 16, 13; Wnt5b/Ror2 + SP600125: n = 35, 34, 38, 54, n = numbers of cytonemes in three biological repeats). Significance is calculated by two-way ANOVA together with Dunnett multiple comparisons test. p-values as indicated. c,d. PAC2 cells were transfected with indicated constructs and processed with a Wnt5a/b (c) and a Ror2 (d) antibody and phalloidin 405. Scale bar 20 µm. e. Fluorescence intensity of secondary antibody in IRSp534K-GFP and CDC42T17N-GFP transfected PAC2 cells processed with Wnt5a/b antibody. (n = 28,23, 26, n = 28,31,22, n = number of cells in three biological repeats). Significance is calculated by the Kruskal-Wallis non-parametric test with a Bonferroni correction for multiple comparisons. f. Fluorescence intensity of secondary antibody in IRSp534K-GFP and CDC42T17N-GFP transfected PAC2 cells processed with Ror2 antibody. (n = 23,26,23, n = 23,32,29, n = number of cells in three biological repeats). Significance is calculated by the Kruskal-Wallis non-parametric test with a Bonferroni correction for multiple comparisons. Box and whisker plots (b,e,f) show median, upper and lower quartile range with whiskers for minimum and maximum values.

