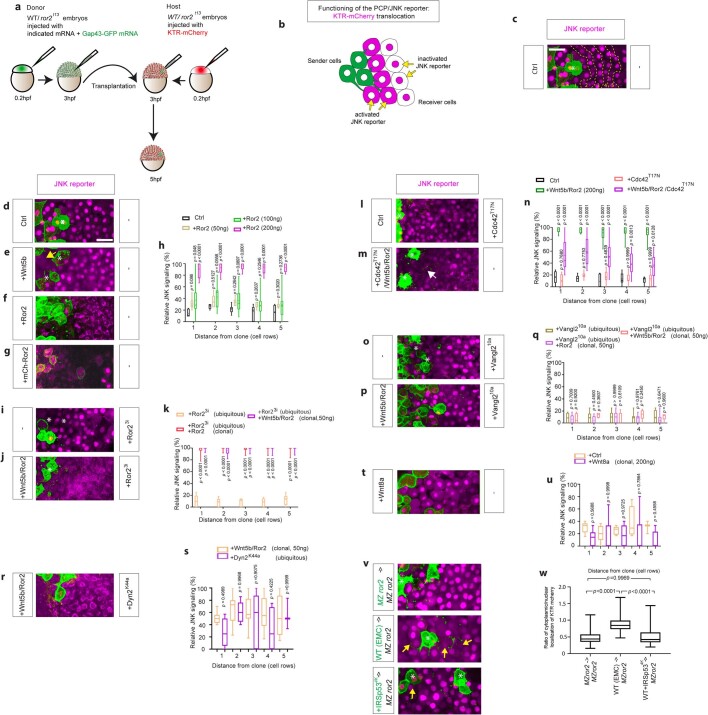
Extended Data Fig. 6. Wnt5b/Ror2 expressing clones activate autocrine and paracrine JNK signaling.
a. Schematic drawing illustrates the transplantation strategy from a WT or ror2t13 donor to a ror2t13 mutant host (for Extended Data Fig. 6v,w). b. Schematic drawing of principle of the JNK signaling KTR-reporter. c. Principle of measurements of cell rows (1–5), around the Wnt5b/Ror2-expressing clones. Scale Bar 20 µm. d,e,f,g,i,j,l,m,o,p,r,t. Wild-type zebrafish embryos were ubiquitously injected with KTR-mCherry and indicated constructs (ubiquitous, in the right box). At the 8-cell stage, one blastomere was injected with the indicated constructs (clonal, in the left box) to generate clones at the embryonic margin and imaged live at 6 hpf. White stars indicate the signaling-producing clonal cells expressing memGFP. Scale Bar 20 µm. g. N-terminal fusion of mCherry with Ror2 activates JNK signaling around the clone, similar to the C-terminal fusion. h,k,n,q,s,u. Relative JNK signaling within 5 cell rows distance from clone when injected with different amounts of Ror2 (n = 7, 7, 11, 10, n = numbers per embryo, 3 biological repeats), Cdc42T17N (n = 6, 12, 11, 14, n = numbers per embryo, 3 biological repeats), with ubiquitous Ror23i (n = 9, 10, 11, n = numbers of embryos, 3 biological repeats), ubiquitous Vangl210a (n = 11, 11, 6, n = numbers of embryos, 3 biological repeats), ubiquitous Dynamin2K44A (n = 8,5, n = number of embryos, 3 biological repeats), with clonal Wnt8a (n = 5,7, n = number of embryos, three biological repeats). Significance is calculated by two-way ANOVA with Dunnett (h,n,k,q) and Sidak’s (s,u) multiple comparisons test. p-values as indicated. v,w. Transplantation assay. ror2t13 cells or WT cells or WT cells expressing IRSp534K were labeled with memGFP (white asterisks) and grafted into a ror2t13 mutant embryo microinjected with the KTR JNK reporter. Yellow arrows highlight cells targeted by cytonemes in which KTR mCherry is shifted from the nucleus to the cytoplasm, indicating JNK activation, asterisks represent the location of grafted cells. w. Quantification of the cytoplasmic/nuclear ratio of KTR mCherry in the neighboring cells of 2–5 grafted cells from 7 different embryos per treatment. Significance is calculated by a one-way ANOVA together with a Dunnett multiple comparisons test. p-values as indicated, Scale bars 20 µm.

