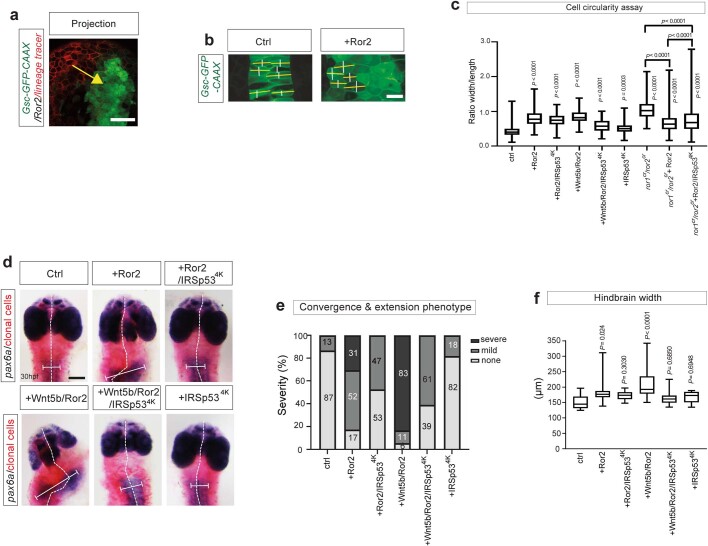
Extended Data Fig. 8. Principles of convergence and extension assay.
a. An example maximum projection image to illustrate the proximity of the lineage tracer labeled clones (red) to Tg(Gsc-GFP-CAAX) expressing cells in the embryo shown in Fig. 5a–i. The yellow arrow shows the proximity. Scale bar is 50 µm b. Circularity assay. Some example cells illustrate how the width of a cell in parallel to the body axis (white lines) or perpendicular to the body axis (yellow line) was measured in a WT embryo or an embryo with a Ror2 expressing clone at 24 h. The ratio between the yellow line and the white line was calculated. A perfect circular cell has a circularity of 1.0, while below or above 1.0 indicates a noncircular, elongated shape. Scale bar is 20 µm. c. Cell circularity was measured within each embryo (n = 173, 292, 194, 200, 149, 176, 305, 458, 607 n = numbers per cell, 3 biological repeats). A perfect circular cell has a circularity of 1.0, while below or above 1.0 indicates a noncircular, elongated shape. d. Wild-type zebrafish embryos injected with mRNA for the indicated constructs plus Mini-Emerald (lineage tracer), subsequent in situ hybridization against pax6a. White dashed lines indicate the course of the midline, and the white bars indicate the width of the hindbrain domain. Scale bar 200 µm. e. The quantitative analysis of phenotype severity in zebrafish embryos. The phenotype severity is classified into none (e.g. ctrl), mild (e.g., +Ror2), and severe (e.g., +Wnt5b/Ror2). Ctrl, +Ror2 and +Wnt5b/Ror2 are representative examples of the different severity classifications, respectively. Numbers in bars represent the percentage of total embryos in each group. f. Hindbrain width was measured in embryos. n = 13, 23, 19, 18, 23, 11, n = numbers per embryo, 3 biological repeats. Significance is calculated by a one-way ANOVA test plus a Tukey multiple comparisons test. Box and whisker plots (c,f) show median, upper and lower quartile ranges with whiskers for minimum and maximum values.

