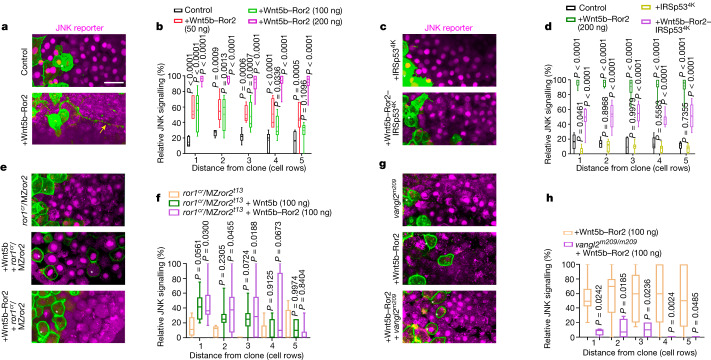
Fig. 4. Wnt5b–Ror2-expressing clones activate paracrine JNK signalling.
a,c,e,g. Wild-type (a,c), ror1cr/ror2t13 (e) and vangl2m209 (g) zebrafish embryos ubiquitously expressing the JNK reporter KTR–mCherry, with clones expressing Wnt5b–Ror2 (a), Wnt5b–Ror2–IRSp534K or IRSp534K(c), Wnt5b or Wnt5b–Ror2 (e), or Wnt5b–Ror2 (g) at the embryonic margin were imaged alive at 6 hpf. White stars, signal-producing cells; yellow arrow, an example of a cytoneme approximately 80 µm long. Scale bar, 20 µm. b, Relative JNK signalling within five cell rows distance of the clone when injected with different amounts of clonal Wnt5b–Ror2 in wild-type embryos. Left to right: n = 7 (control), 7 (50 ng), 12 (100 ng) and 12 (200 ng) embryos, 3 biological repeats. d, Relative JNK signalling within five cell rows distance of the clone when injected with indicated constructs. Left to right: n = 6 (control), 12 (Wnt5b–Ror2), 8 (IRSp534K) and 9 (Wnt5b–Ror2–IRSp534K) embryos, 3 biological repeats. f, Relative JNK signalling within five cell rows distance of the clone when injected with clonal Wnt5b or Wnt5b–Ror2 in ror1cr/ror2 t13 embryos. Left to right: n = 5 (ror1cr/MZror2t13), 12 (ror1cr/MZror2t13 + Wnt5b (100 ng)) and 9 (ror1cr/MZror2t13 + Wnt5b–Ror2 (100 ng)) embryos, 3 biological repeats. b,d,f, Two-way ANOVA with Dunnett’s multiple comparisons test. h, Relative JNK signalling within five cell rows distance of the clone when injected with clonal Wnt5b–Ror2 in wild-type and vangl2m209 embryos. n = 15 (Wnt5b–Ror2) and 4 (vangl2m209 + Wnt5b–Ror2) embryos, 3 biological repeats. Two-way ANOVA with Sidak’s multiple comparisons test. Box and whisker plots show median, and top and bottom quartile ranges, with whiskers extending to minimum and maximum values. P values are indicated.

