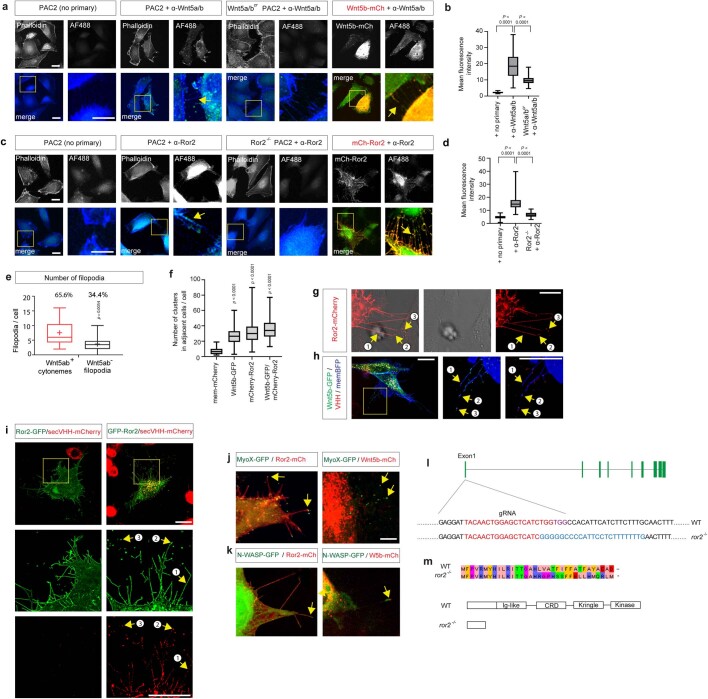
Extended Data Fig. 1. Wnt5b/Ror2 transport in vitro and in vivo.
a,c. Wildtype; double crispants wnt5a/b; ror2−/− & Wnt5b-mCh or Ror2-mCh transfected zebrafish fibroblasts processed as described in Fig. 1a,c with/without primary antibodies. A high-magnification image indicates filopodia. Scale bar 10 µm. b,d. Fluorescence intensity of secondary antibody in ‘no primary’ control; Pac2 WT cells, wnt5a/bcr; ror2−/− PAC2 cells. b. (n = 42,52,107 cells, 3 biological repeats). Significance is calculated by one-way ANOVA together with Tukey posthoc test. p-values as indicated, d. (n = 41,73,63 cells, 3 biological repeats). Significance is calculated by Kruskal-Wallis non-parametric test with Bonferroni correction for multiple comparisons. e. Quantification of the number of filopodia versus Wnt5a/b-positive cytonemes of PAC2 cells (n = 17, number of cells, three biological repeats). Two-tailed p-values were determined by a Mann-Whitney test. f. Number of membrane-mCh, Wnt5b-GFP, mCh-Ror2 & Wnt5-GFP/mCh-Ror2 puncta in adjacent non-transfected (brightfield only) cells from Fig. 1f (n = 44, 44, 46, 33, numbers of adjacent cells, three biological repeats). Significance is calculated by one-way ANOVA together with Dunnett multiple comparisons test. p-values as indicated. Box and whisker plots (b,d-f) show median, upper and lower quartile range with whiskers for minimum and maximum values. g. PAC2 fibroblasts transfected with Ror2-mCherry contacting receiving cell (brightfield). 1–3 illustrate stages of Ror2-mCherry transport (see Fig. 1l), from (1) cargo transport along cytonemes and (2) cargo-transporting vesicle buds off from a cytoneme to (3) internalization of the cargo-loaded vesicle. Scale bar 10 µm h-i. Super-resolution image (based on Lattice SIM2 technology) of PAC2 fibroblasts expressing indicated constructs and exposed to secVHH-mCherry to mark extracellular accessible cargo. The numbering describes the steps of cargo transport as described in g. j,k. PAC2 zebrafish fibroblasts transfected with indicated constructs and imaged live at 24 h of post-transfection. Yellow arrows co-localization of indicated markers with Wnt5b or Ror2 on cytonemes. Scale bar 5 µm. l,m. Verification of CRISPR/Cas9-based knock-out of Ror2 by Sanger sequencing. Binding sites for gRNA and PAM are indicated.

