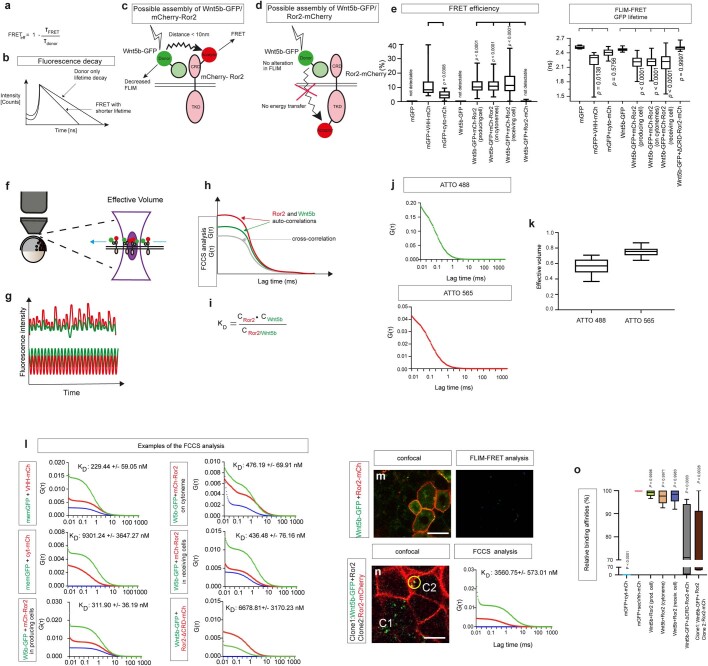
Extended Data Fig. 3. Principles of FLIM-FRET analysis of Wnt5b/Ror2 complexes.
a. FRET efficiency, FRETeff, is defined as the fraction of photons that is transferred from a donor to an acceptor. τFRET, a lifetime of the donor in the presence of the acceptor; τdonor, lifetime if the donor is without the acceptor. b. Bi-exponential fitting of the fluorescence decay demonstrates that the lifetime of a donor is decreased in the presence of a FRET acceptor. c. Close packaging in the Wnt5b-GFP/mCherry-Ror2 complex allows FRET to the acceptor and, thus, reduces donor FLIM. d. A C-terminally fused Ror2-mCherry can be used as a negative control like the distance between donor and acceptor is too large, and the plasma membrane acts like as insulator. e. Quantification of FRET efficiency (n = 0, 17, 24, 0, 36, 22, 30, 11, n = regions of interests in three biological repeats). Significance is calculated by a one-way ANOVA test plus Dunnett multiple comparisons test. p-values shown on the graph are compared to the corresponding negative controls, indicated on the graph. Quantification of fluorescent GFP lifetime (n = 8, 47, 25, 21, 36, 23, 33, 11, n = regions of interest in three biological repeats). Significance is calculated by a one-way ANOVA test plus Tukey multiple comparisons test. p-values shown on the graph are compared to the corresponding negative controls indicated on the graph. f. Schematic representation of the confocal detection volume positioned on the plasma membrane in a living zebrafish embryo to measure ligand-receptor interactions. g. Fluctuations in the detected fluorescence intensities with time. h. Auto- and cross-correlation analysis of fluorescence fluctuations over time. The Grey curve represents the cross-correlation between Wnt5b-GFP and Ror2-mCherry. i. The dissociation constant KD is defined as the fraction of the concentration of the unbound ligands and unbound receptors to the concentration of the ligand-receptor complexes. j. Autocorrelation curves of ATTO 488 and ATTO 565 in solution to determine the FCCS volume. k. Determination of the FCS volume obtained from n = 10 independent samples of labeled protein stock solutions. l. For FCCS analysis, the auto-correlation curves for Wnt5b-GFP and Ror2-mCherry are shown in red and green, respectively. The cross-correlation curve is shown in blue. The corresponding average dissociation constant (KD) is indicated on the graph. m-n. Representative fluorescence images for FCCS measurements and example measuring spots (yellow circle) in the zebrafish embryo at 6hpf, injected with indicated mRNA. C1 indicates the Wnt5b-GFP/Ror2 positive clone, and C2 indicates a clone expressing Ror2-mCherry. Scale bar 10 µm. o. Relative binding affinities measured by FCCS for indicated fluorescent protein combinations from Fig. 2h. Significance is calculated by one-way ANOVA together with Dunnett multiple comparisons test. Box and whisker plots (e,k,o) show median, upper and lower quartile range with whiskers for minimum and maximum values.

