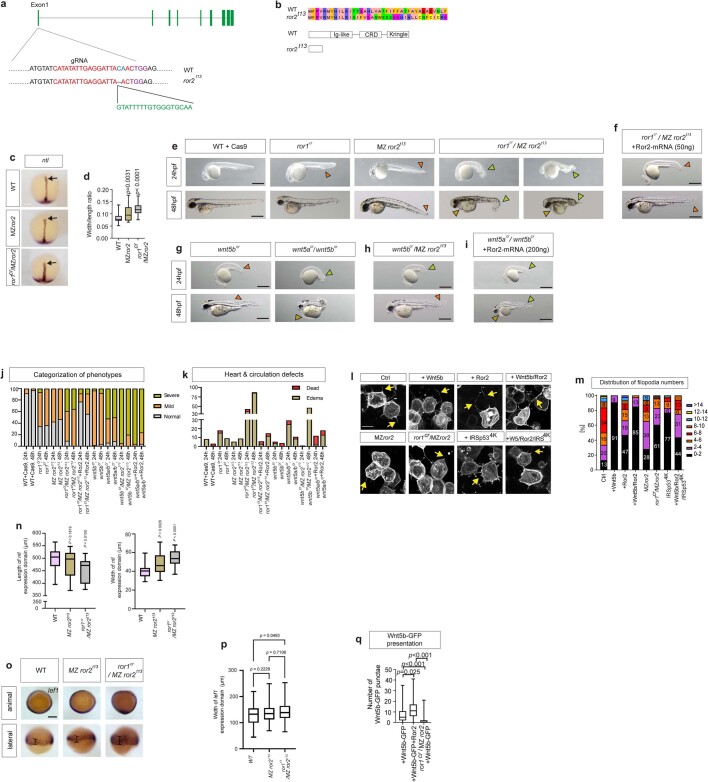
Extended Data Fig. 4. Generation of the zebrafish mutant line ror2t13.
a. By using the CRISPR/Cas9 technology, a deletion/insertion mutant for Ror2 was generated. An insertion of 25 amino acids led to a new termination site of the protein at position 38. b. CRISPR/Cas9-based deletion/insertion generated a truncated Ror2 protein. c. ntl expression in indicated mutant lines. d. Width/length ratio of ntl expression (n = 38, 25, 13 embryos, 3 biological repeats) including a one-way ANOVA test with a Dunnett multiple comparisons test. p-values as indicated. Scale bar = 100 µm. e. Morphology phenotypes for WT +Cas9, ror1cr, ror2t13, ror2t13 & ror1cr/ ror2t13 24 and 48hpf larvae. f. Morphology phenotypes of ror1cr/ror2t13 24 and 48 hpf larvae with 50 ng Ror2 mRNA injected at 1-cell. g. Morphology phenotypes of Wnt5bcr & Wnt5a/Wnt5bcr, h. Wnt5bcr/ror2t13. Wnt5a/b gRNA sequences (IDT DNA): (wnt5a-AE: AGATCGTGGACGCAAACTCATGG, wnt5a-AF: CGTCGACAACTCCACAGTGCTGG, wnt5b-AD: AGGTGGAAAGCTCACCCTCACGG, wnt5b-AE: GAACCAAGGACACCTACTTCTGG), i. Double crispants wnt5a/wnt5bcr with 200 ng Ror2 mRNA injected at 1-cell at 24 and 48 hpf. Orange and yellow arrowheads show mild and severe tail morphology, light orange arrowheads show heart oedema. (e-i), Scale bar = 500 µm. j. Total percentage of normal, mild and severe phenotypes. k. Quantification of heart and circulation defects (percentage dead or with oedema). (n = 12, 127, 78, 11, 75, 45, 128, 93, 35, 34, 56, 52, 48, 46, 52, 52, 40, 40 embryos, three biological repeats). l. Confocal images of zebrafish embryos injected with indicated constructs or gRNA and imaged at 6hpf. Scale bar 10 µm. m. Quantitation of filopodia numbers per cell in vivo, categories: 0-2, 2–4, 4–8, 8–10, 10–12, 12–14, >14. Percentage is shown on the bar (n = 98, 43, 119, 40, 32, 71, 65, 16 cells, three biological repeats). n. Quantification of length and width of ntl expression domain in wild type, ror2t13 & ror1cr/ror2t13 embryos from Extended Data Fig. 4c (n = 38, 25, 13 embryos, 3 biological repeats). Significance is calculated by one-way ANOVA together with Dunnett multiple comparisons test. p-values as indicated. o. in situ hybridization of lef1 expression of wild type, ror2t13 & ror1cr/ror2t13 50% epiboly embryos (animal pole and lateral view). Black line shows width of domain. Scale bar 200 µm. p. Quantification of width of lef1 expression domain. (n = 38,40,31, n = number of embryos). Significance is calculated by one-way ANOVA together with Tukey multiple comparisons test. p-values as indicated. q. Wnt5b-GFP puncta on plasma membrane of producing cells (n = 9, 6,9 embryos, three biological repeats). A Kruskall-Wallis non-parametric multiple comparisons test, with a Bonferroni correction for multiple comparisons was used. Box and whisker plots (d,n,p,q) show median, upper and lower quartile range with whiskers for minimum and maximum values.

