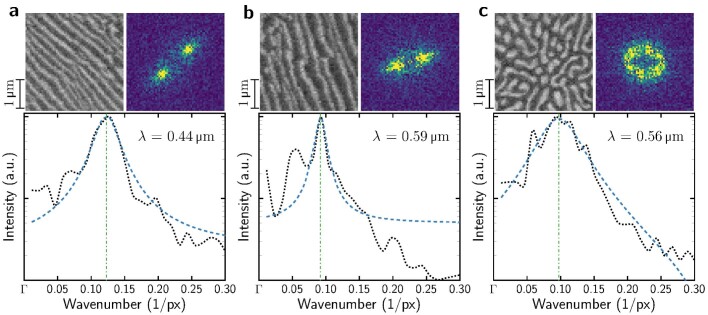
Extended Data Fig. 2. High-entropy ceramic microstructure.
Fourier analysis of the spinodal microstructure in the three magnified regions (a, b, c) of (HfMoNbTaW)CN in Fig. 2. Each sub-figure contains the image contrast (left) and the power spectrum of its Fourier transform (right). The black dotted line is the radial distribution function of the power spectrum which was smoothed using a Savitzky-Golay filter, to help identify the maxima in the signal. The blue dashed line is a fit of the Cauchy-Lorentz distribution to the radial distribution function. The green dotted-dashed line is the location of the distribution peak. a.u., arbitrary units.

