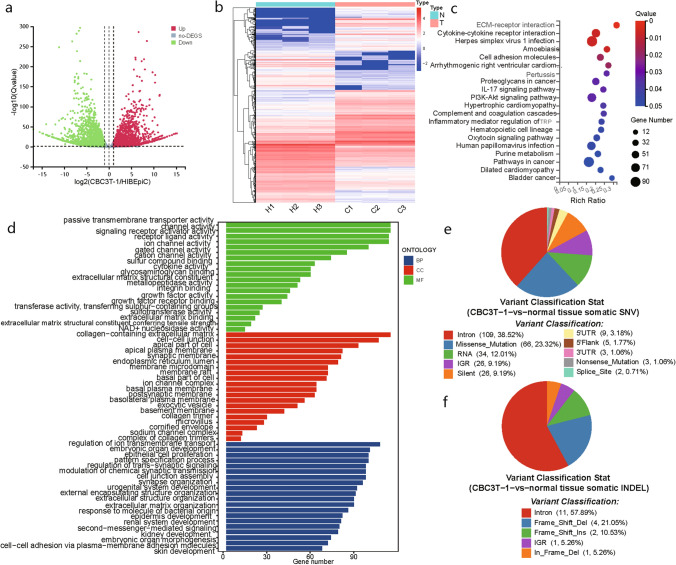
Fig. 6.
RNA-seq and WES of CBC3T-1 cells. a Differentially expressed genes between CBC3T-1 and HIBEpiC (|log2FC|> = 1; Q value < 0.05). b Heatmaps of up- and downregulated DEGs (|log2FC|> = 2; Q value < 0.01). c KEGG analysis reveals the top 20 genomic pathways for DEGs. d GO analysis revealed significant enrichment of DEGs in the top 20 terms of the three main functions. e Somatic SNV annotation result distribution map. f Somatic InDel annotation result distribution map

