Fig. 2.
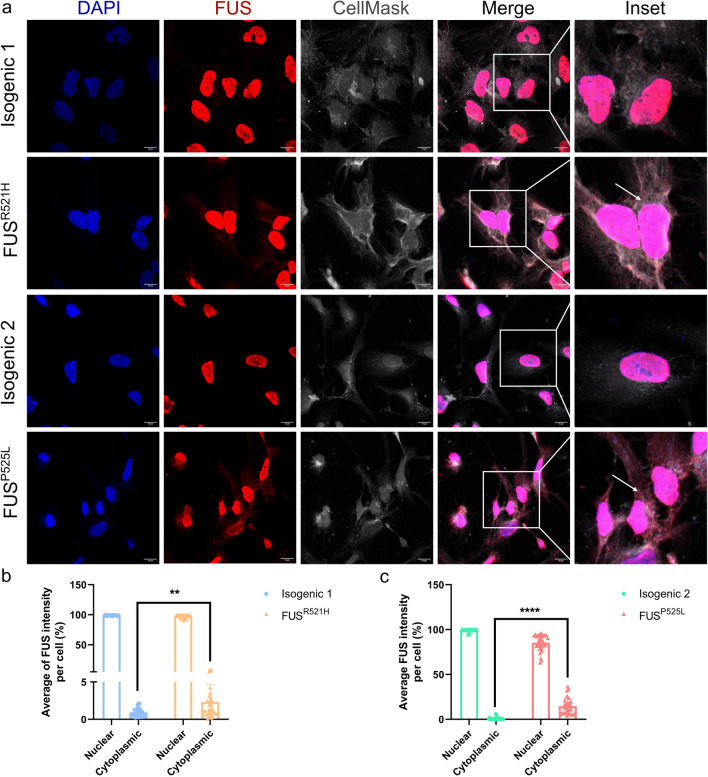
Cytoplasmic FUS accumulation in mutant FUS iPSC-derived OPCs. a Representative confocal images of FUS protein cellular localization on DIV26-30 OPCs generated from FUSP525L, FUSR521H and their isogenic control hiPSCs (scale bar: 10 μm). Nuclei are stained with DAPI and cytoplasm with CellMask. Arrows in the inset indicate FUS mislocalization in the cytoplasm of mutant FUS OPCs. Quantification of nuclear and cytoplasmic FUS staining in FUSR521H mutant OPCs (b) and FUSP525L mutant OPCs (c) and their respective isogenic controls. Statistical analyses were performed by unpaired two-tailed t tests. Data are represented as mean ± SD from three biological replicates with three technical replicates in each experiment (n = 30 images and n > 150 nuclei/condition). **p < 0.01 ****p < 0.0001

