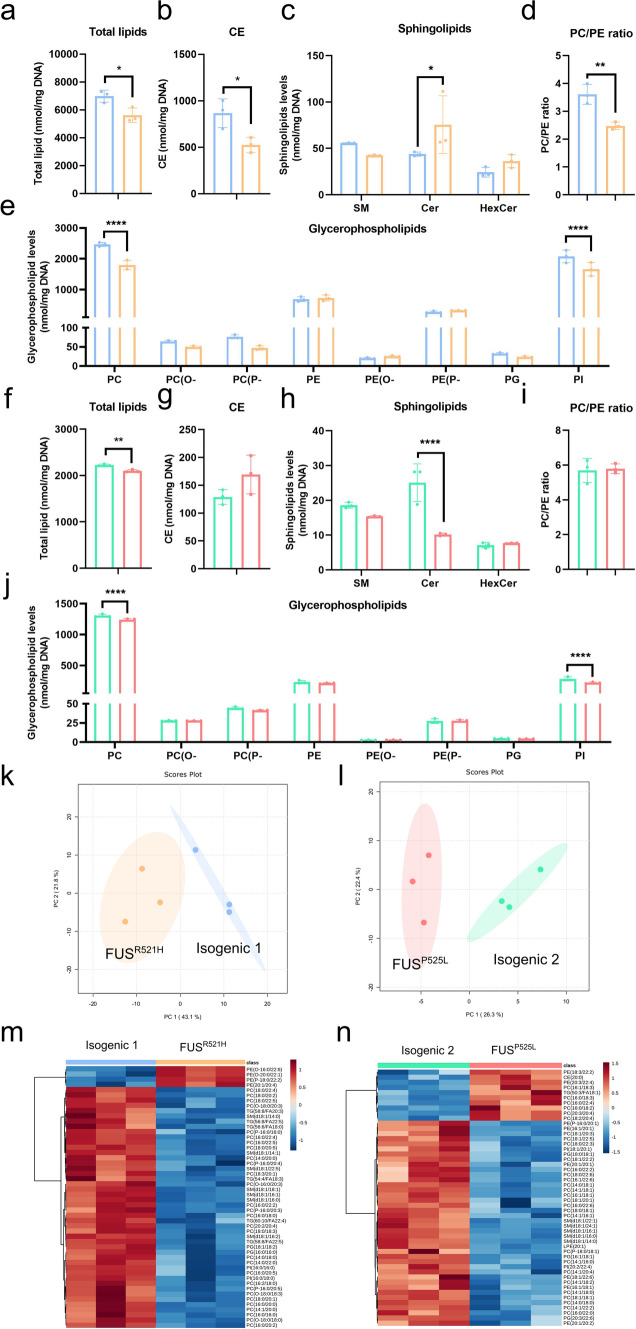
Fig. 4.
Lipidome analysis identified lipid metabolism defects in mutant FUS iPSC-derived OPCs. Quantification of total lipid concentrations (nmol/mg DNA) by mass spectrometry in FUSR521H mutant OPCs (a) and FUSP525L mutant OPCs (f) and their respective isogenic controls (N = 3 independent differentiations). Quantification of cholesterol ester (CE) and sphingolipid concentrations (SM, Cer, and HexCer) in FUSR521H mutant OPCs (b, c) and FUSP525L mutant OPCs (g, h) and their respective isogenic controls. Quantification of glycerophospholipid subclasses (PC, PC(O-), PC(P-), PE, PE(O-), PE(P-), PG, and PI) in FUSR521H mutant OPCs (e) and FUSP525L mutant OPCs (j) and their respective isogenic controls. PC to PE concentration ratio in FUSR521H mutant OPCs (d) and FUSP525L mutant OPCs (i) and their respective isogenic controls. PCA plot of lipidomic data in FUSR521H mutant OPCs (k) and FUSP525L mutant OPCs (l) and their respective isogenic controls. m, n Heatmap representing all clustered samples and color-coded normalized concentrations of the top 50 most significantly altered individual lipid species (one-way ANOVA, p < 0.05, FDR corrected). (PC, phosphatidylcholine; PC(O-), alkylphosphatidylcholine; PC(P-), alkenylphosphatidylcholine; PE, phosphatidylethanolamine; PE(O-), alkylphosphatidylethanolamine; PE(P-), alkenylphosphatidylethanolamine; PG, phosphatidylglycerol; PI, phosphatidylinositol; SM, sphingomyelin; Cer, ceramide; HexCer, hexose-ceramides). Statistical analyses were performed by unpaired two-tailed t tests to compare FUS-mutant OPCs and their respective controls (a, b, d, f, g, and i) and two-way ANOVA with the Bonferroni’s multiple comparisons test (c, e, h, and j). Data are represented as mean ± SD. *p < 0.05 **p < 0.01 ****p < 0.0001

