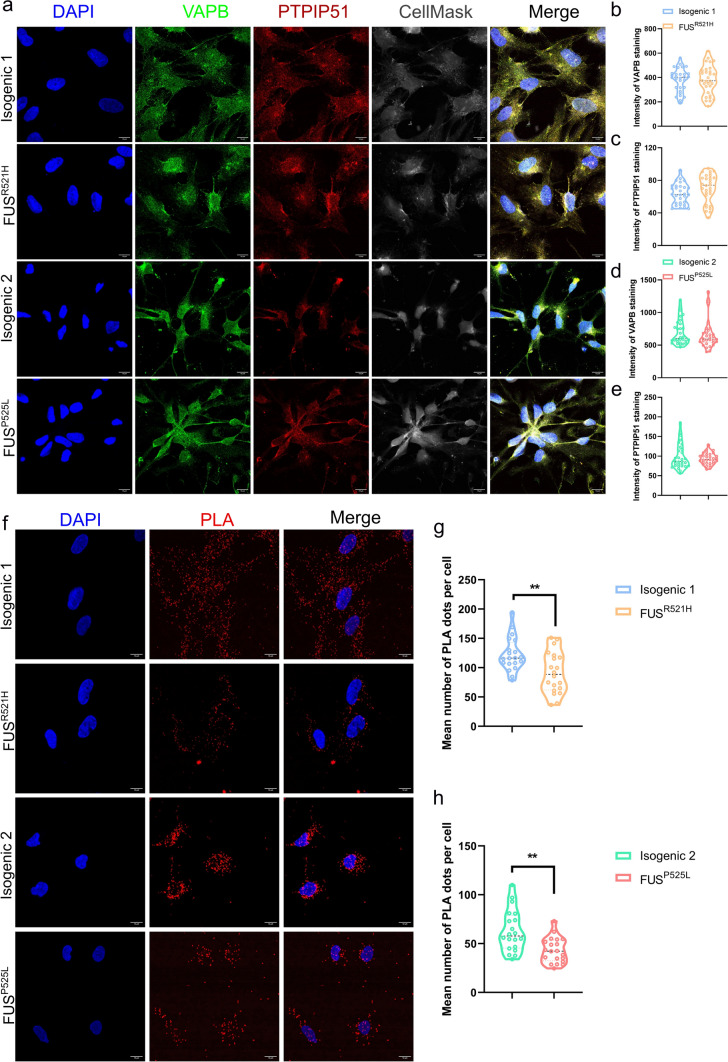
Fig. 6.
MAM disruption in mutant FUS iPSC-derived OPCs. a Immunofluorescent staining for DAPI, VAPB, and PTPIP51 on DIV26-30 OPCs generated from FUSP525L, FUSR521H and their isogenic control hiPSCs (scale bar: 10 μm). b, d Violin plot of the intensity of VAPB staining on FUSP525L and FUSR521H OPCs, and their isogenic controls. Each symbol represents the mean intensity of VAPB from an image. Data are represented as mean ± SD from 3 biological (N = 30 images). c, e Violin plot of intensity of PTPIP51 staining on FUSP525L and FUSR521H OPCs, and their isogenic controls. Each symbol represents the mean intensity of PTPIP51 from an image. Data are represented as mean ± SD from three biological (N = 30 images). f Proximity ligation analysis (PLA) using antibodies against VAPB and PTPIP51 (VAPB/PTPIP51, red) FUSP525L and FUSR521H OPCs, and their isogenic controls. Nuclei were stained with DAPI (blue). Scale bars are 10 μm. g, h Violin plot of quantification of the PLA signal in FUSR521H and isogenic control OPCs (h) and FUSP525L and isogenic control OPCs (i). Each symbol represents the mean number of PLA dots per cell from one image. Statistical analyses were performed by unpaired two-tailed t tests to compare mutant FUS OPCs and their controls. Data are represented as mean ± SD from three biological replicates with three technical replicates in each experiment (N = 20 images and n > 100 nuclei/condition). **p < 0.01

