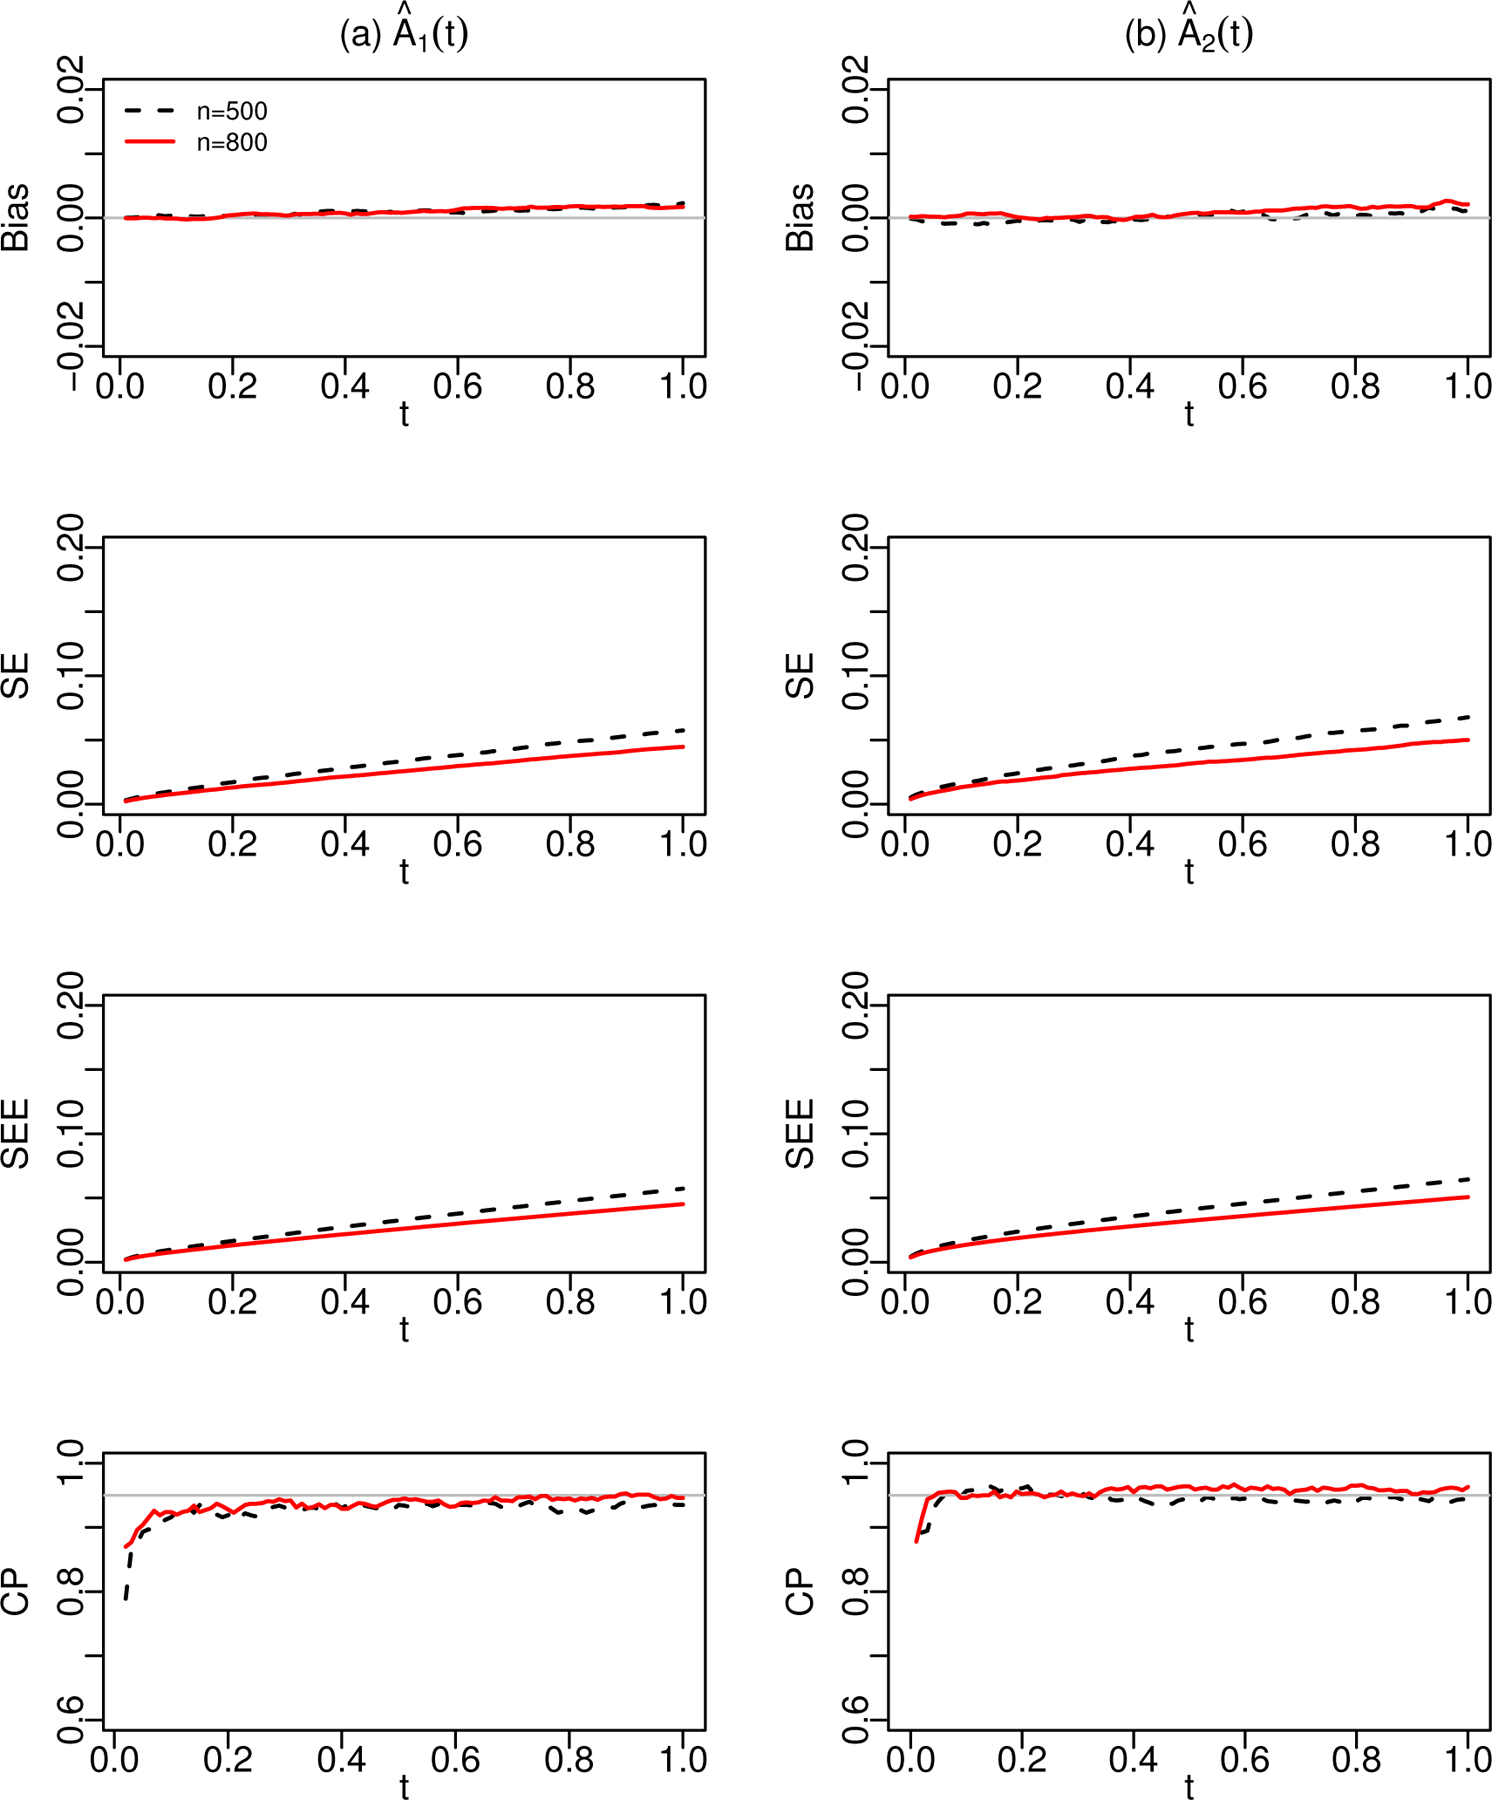
Figure 1.

Estimation results for (a) and (b) in Scenario 1, under the logarithmic transformation with . The dashed and solid lines are for data sets with and , respectively. Bias, SE, SEE, and CP stand, respectively, for the bias, empirical standard error, mean of the standard error estimator, and empirical coverage probability of the 95% confidence interval.
