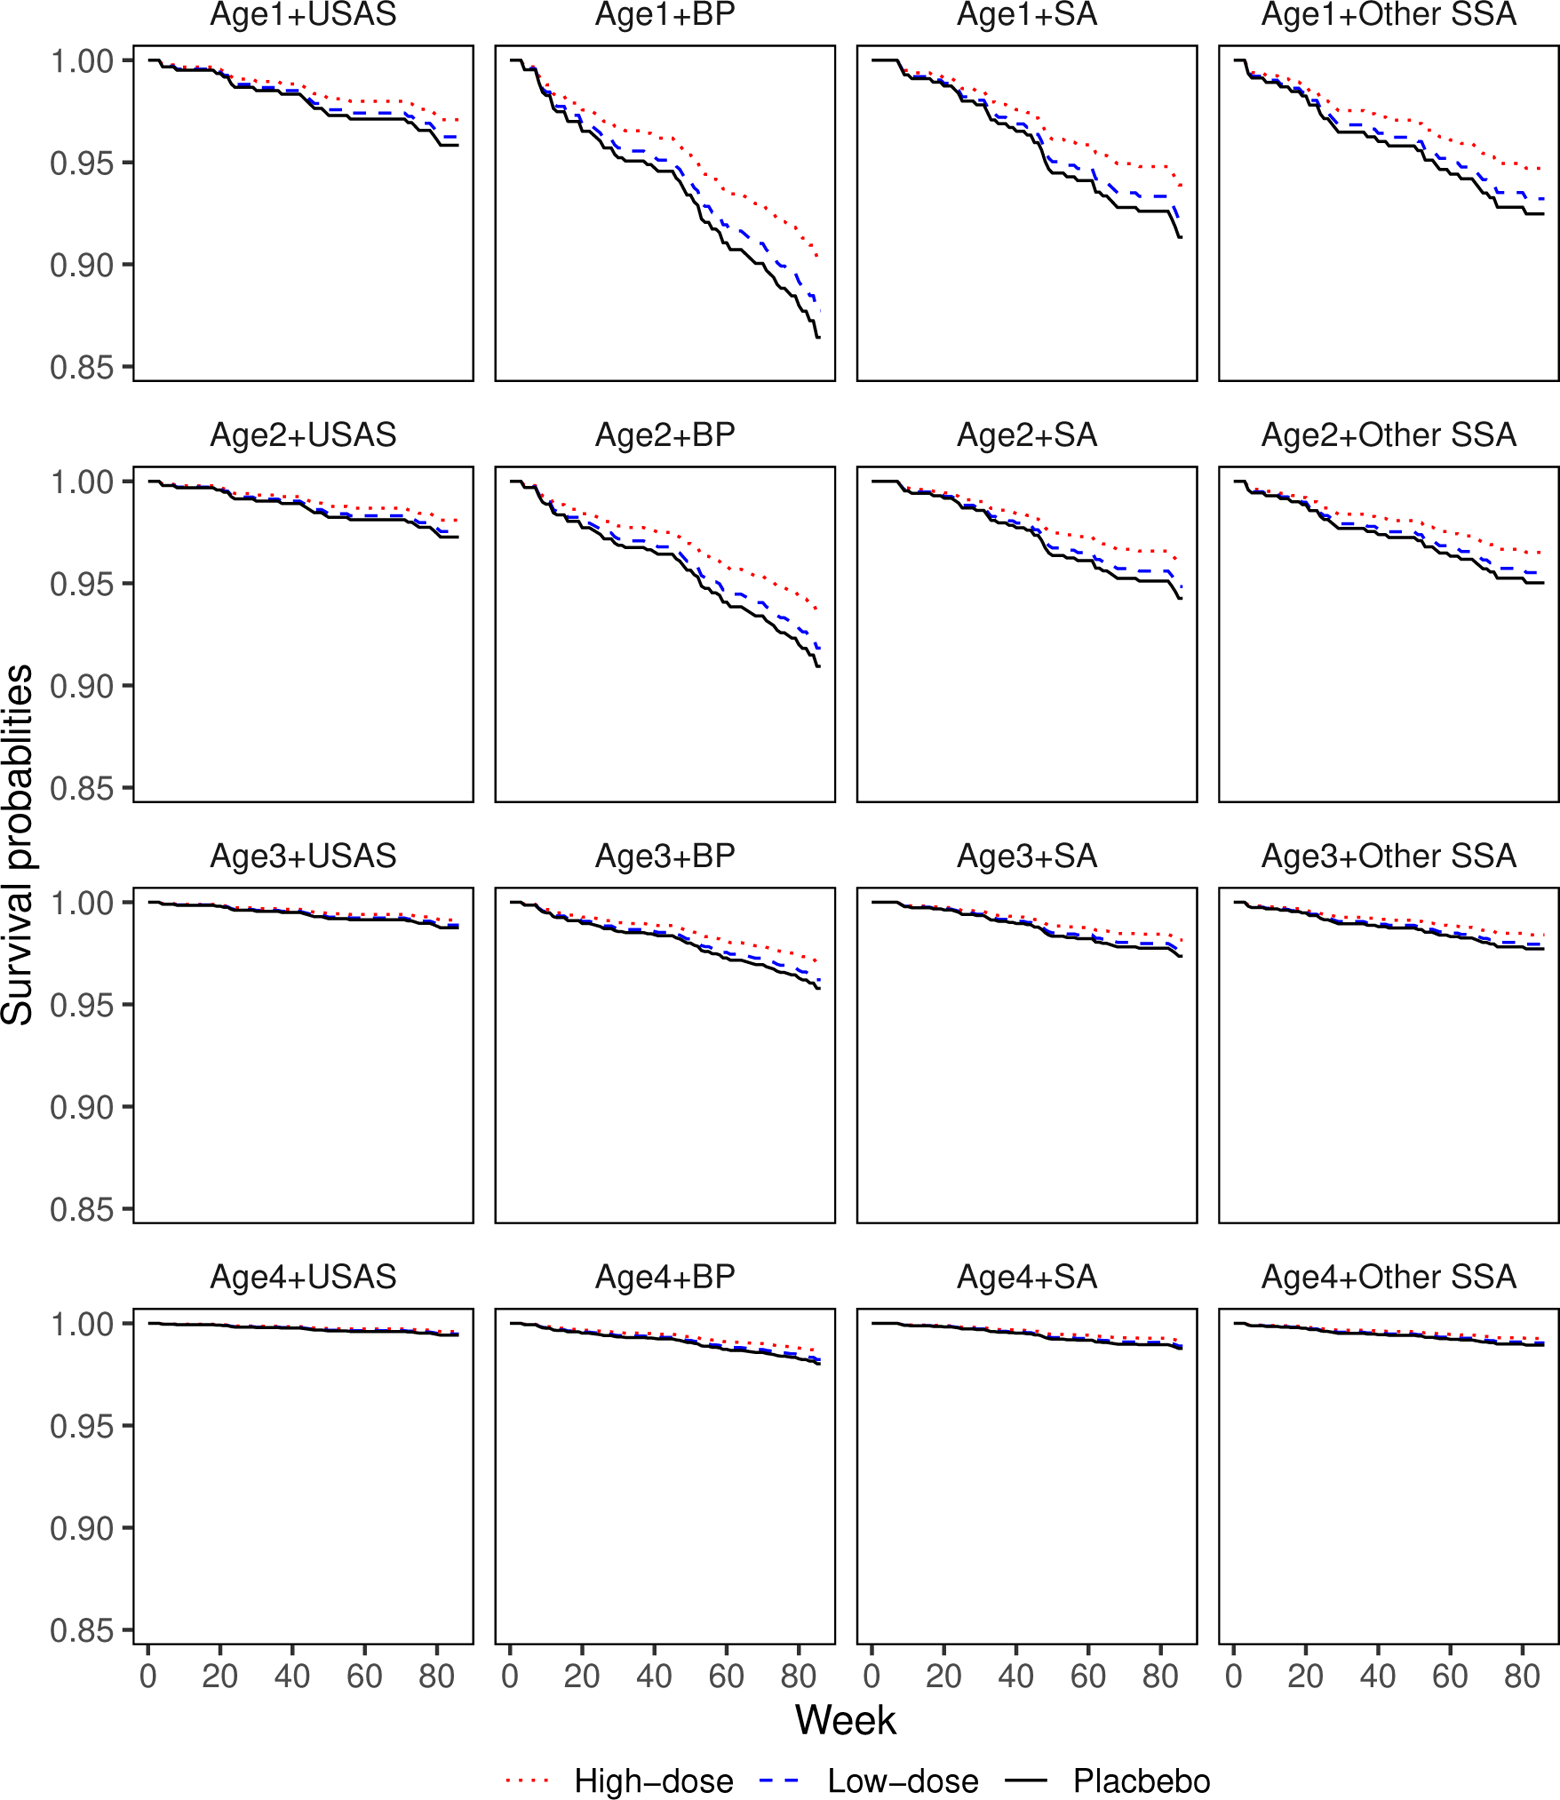
Figure 4.

Estimated survival functions by considering different combinations of covariates under the proposed model with the transformation with . Here, “Age1”, “Age2”, “Age3” and “Age4” stand for the age goups, [17, 20], [21, 30], [31, 40] and [41, 52], respectively. “USAS”, “BP”, “SA” and “Other SSA” represent USA and Switzerland, Brazil and Peru, South Africa and other sub-Saharan African countries, respectively.
