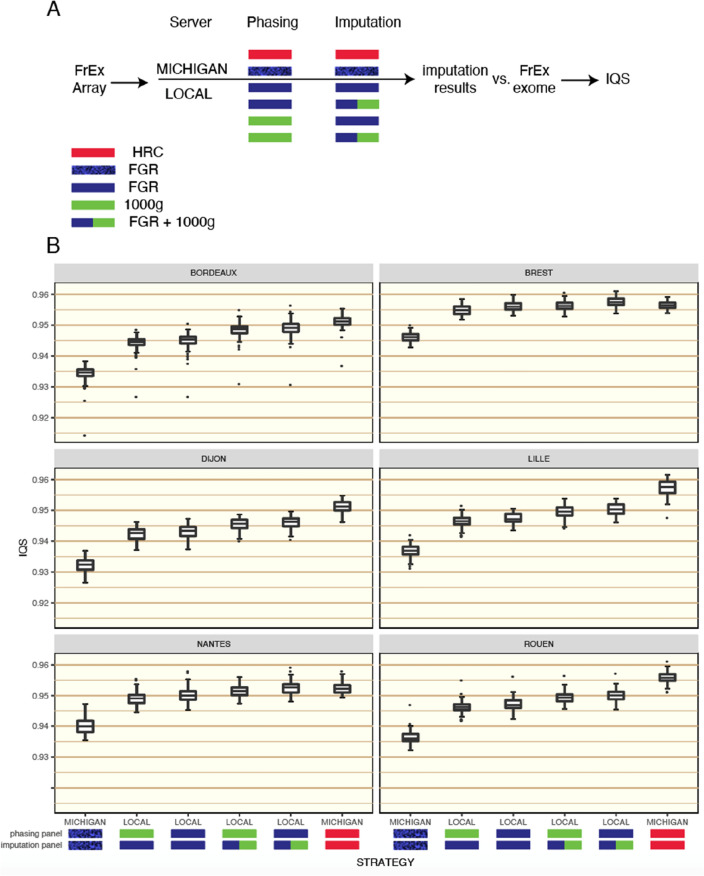
Figure 2.
IQS scores for individuals in FrEx for different pipelines. Results are split between the 6 cities of FrEx. Section (A) depicts the different possible phasing and imputation strategies that were tested, running either on the Michigan server or locally (LOCAL) in our lab and with different combinations of phasing and imputation panels. Section (B) gives boxplots of individual level IQS scores for each strategy. Of the 550 individuals analysed, 89 are from Bordeaux, 96 from Brest, 87 from Dijon, 93 from Lille, 90 from Nantes, and 95 from Rouen.

