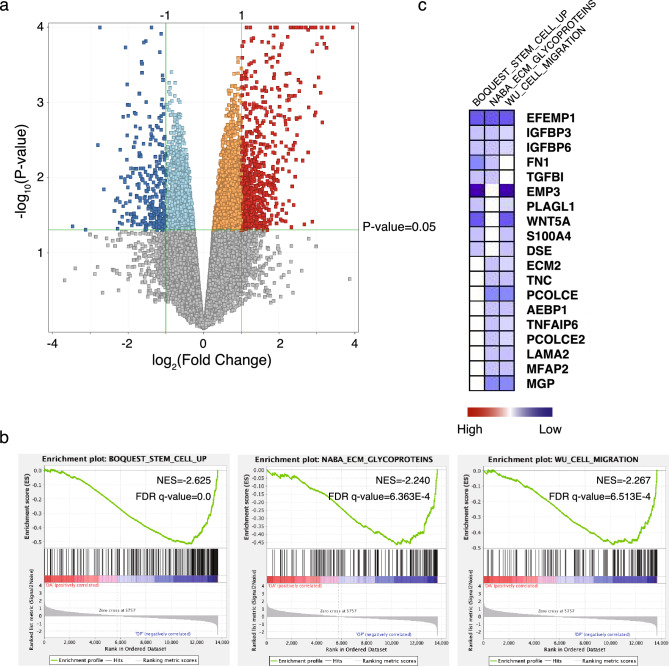
Figure 3.
Identification of potential pathways and processes involved in the long-term consequences of early parental deprivation. (a) Volcano plot of human hand-reared aged marmosets vs parent-reared aged marmosets. In the plot, 381 genes that exhibited upregulation in the human hand-reared marmosets were shown in red color (fold change > 2.0, P < 0.05). On the other hand, 186 genes that displayed downregulation were shown in blue color (fold change < −2.0, P < 0.05). (b) GSEA of the BOQUEST STEM CELL UP, NABA ECM GLYCOPROTEINS, and WU CELL MIGRATION enriched in human hand-reared marmosets compared to parent-reared aged marmosets. (c) Heat Map illustrates the partially or completely overlapped genes among BOQUEST STEM CELL UP, NABA ECM GLYCOPROTEINS, and WU CELL MIGRATION gene sets. The intensity of the blue color indicates the degree of decreased expression.

