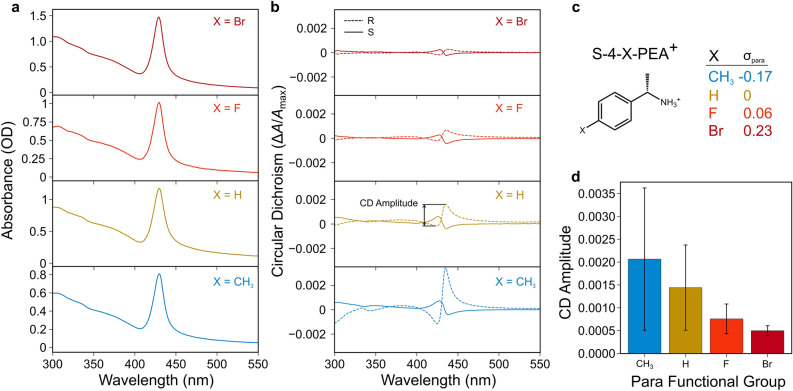
Figure 2.
Optical properties of chiral perovskite QDs. UV–Vis absorbance (a) and circular dichroism (b) spectra of representative samples of CsPbBr3 QDs dispersed in toluene following ligand exchange with S-4-X-PEABr (solid lines) or R-4-X-PEABr (dashed lines), with functional group X = CH3, H, F, or Br having σpara values in the Hammett equation as indicated in (c). Mean CD amplitudes, calculated as the peak-to-trough difference of the bisignate feature associated with the first exciton transition at ~ 429 nm, are shown in the bar plot in panel (d), with error bars representing standard deviations among samples from at least 6 different syntheses for each functional group (both R and S enantiomers are lumped together for this analysis).

