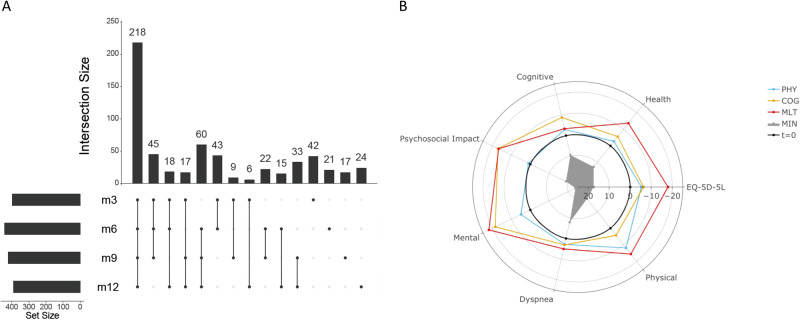
Fig. 1. Survey completion and clustering of participant-reported outcomes after hospital discharge (N = 590).
A Upset plot depicting the number of participants completing surveys at 3 (m3), 6 (m6), 9 (m9), and 12 months (m12) after hospital discharge. B Radar plot showing relative deficit for each of four different clusters across several participant-reported outcomes: EQ-5D-5L Health Recovery Score (Health), PROMIS Cognitive Function Score (Cognitive), PROMIS Psychosocial Illness Impact Positive Score (Psychosocial), PROMIS Global Mental Health Score (Mental), PROMIS Dyspnea Score (Dyspnea), and PROMIS Physical Function Score (Physical). The radial axis denotes a t-statistic comparing the within-cluster mean to the remaining sample, with t = 0 denoting the overall sample mean and negative values denoting a deficit. The 4 clusters are: solid gray, minimal deficit (MIN); blue line, physical predominant deficit (PHY); yellow line, mental/cognitive predominant deficit (COG); and red line, multidomain deficit (MLT). PROMIS Patient-Reported Outcomes Measurement Information System.

