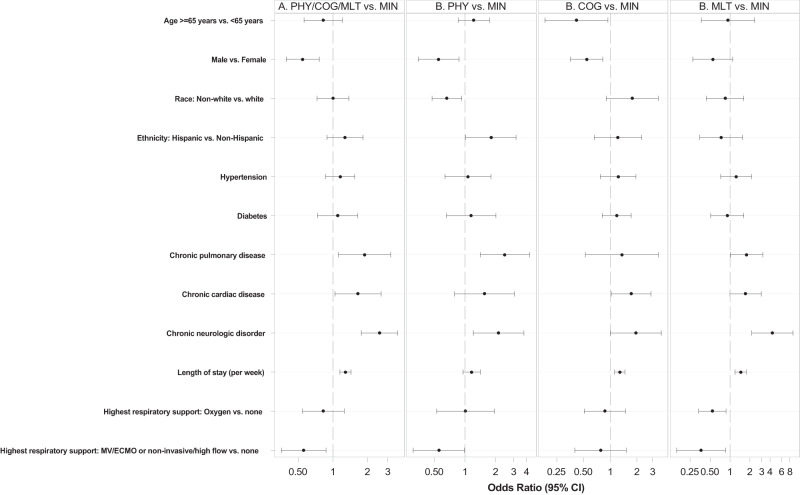
Fig. 2. Forest Plot showing adjusted odds ratios (ORs) for factors associated with patient-reported outcome (PRO) clusters with more deficits compared to minimal deficit, using multivariable multinomial logistic regression (N = 590).
A Comparison of PRO clusters PHY, COG, and MLT with PRO cluster MIN. B Comparison of PRO clusters PHY and MIN (left); clusters COG and MIN (middle); clusters MLT and MIN (right). MIN minimal deficit, PHY physical predominant deficit, COG mental/cognitive predominant deficit, MLT multidomain deficit, MV Mechanical ventilation, ECMO Extracorporeal membrane oxygenation.

