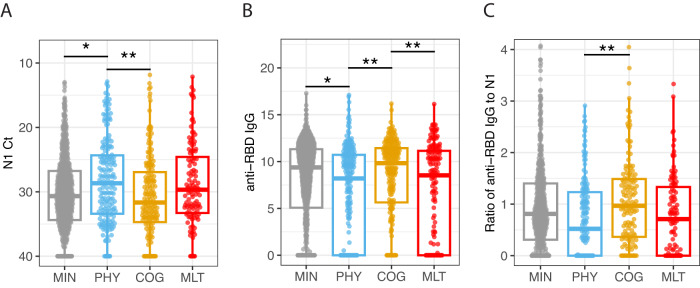
Fig. 3. SARS-CoV-2 viral RNA levels and antibody responses.
A N1 Ct values: shown are SARS-CoV-2 N1 gene PCR cycle threshold (Ct) values (viral loads) measured from samples collected during the first 28 days of hospital admission by four PRO clusters, minimal deficit (MIN, n = 657), physical predominant (PHY, n = 174), deficit, mental/cognitive predominant (COG, n = 172 and deficit, multidomain (MLT, n = 112). Shown are median values (horizontal lines), interquartile ranges (boxes), and 1.5 IQR (whiskers), as well as all individual points. Because lower Ct values indicate higher viral loads, the y axis is reversed. The viral loads were significantly (adj. p = 0.03) associated with the PRO clusters. B anti-RBD IgG values: Shown are anti-RBD IgG values measured from samples collected during the first 28 days of hospital admission by four PRO clusters, minimal deficit (MIN, n = 907), physical predominant (PHY, n = 221), deficit, mental/cognitive predominant (COG, n = 230) and deficit, multidomain (MLT, n = 149). Shown are median values of area under the curve (AUC) (horizontal lines), interquartile ranges (boxes), and 1.5 IQR (whiskers), as well as all individual points. The titers were significantly (adj. p = 0.014) associated with the PRO clusters. C Ratio of anti-RBD IgG to N1 values: shown are scaled ratio of anti-RBD IgG to SARS-CoV-2 viral loads (N1 gene) values from samples collected during the first 28 days of hospital admission by four PRO clusters, minimal deficit (MIN, n = 560), physical predominant (PHY, n = 156), deficit, mental/cognitive predominant (COG, n = 141) and deficit, multidomain (MLT, n = 99). Shown are median values (horizontal lines), interquartile ranges (boxes), and 1.5 IQR (whiskers), as well as all individual points. The ratio of titers to viral loads was also significantly (adj. p = 0.05) associated with the PRO clusters. The four PRO clusters are the following in gray: minimal deficit (MIN), in blue: deficit, physical predominant (PHY), in yellow: deficit, mental/cognitive predominant (COG), and in red: deficit, multidomain (MLT). The lines and asterisks on top of the figure denote pairwise statistical significance, *p < 0.05, **p < 0.01, ***p < 0.001. Statistical differences were determined from generalized linear mixed effects models adjusting for age, sex, participant, and enrollment site. P values were adjusted using the Benjamini-Hochberg method to account for multiple comparisons. See Methods for more details.

