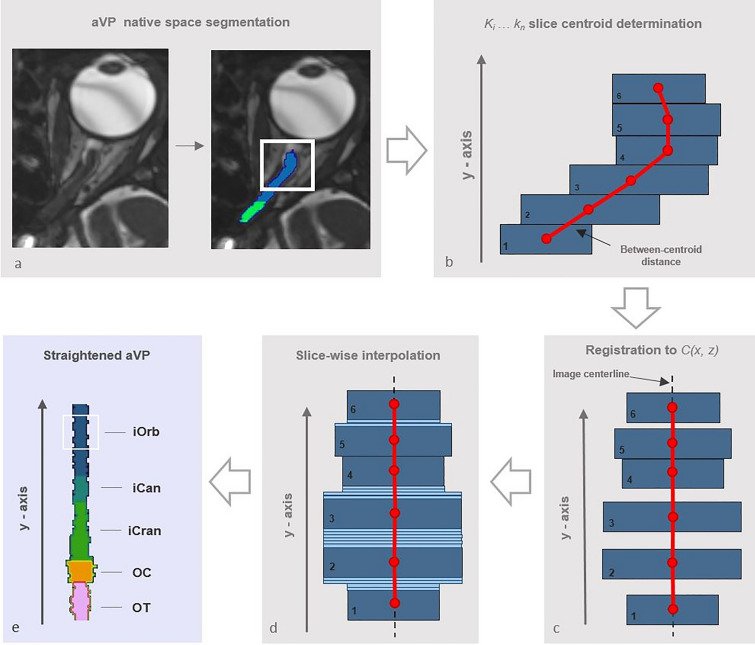
Figure 3.
Diagram illustrating the aVP straightening process. Following manual segmentation in the native space (a), the slice centroids and the corresponding between-centroid distance were calculated (red markers in b). Then, slices were linearly shifted on the (x, z) transverse plane to the image centerline (red line in c), with preservation of the original between-centroid distance and CSA. The resulting gaps between shifted slices were filled by slice-wise interpolation, preserving the average CSA (light-blue slices in d). Finally, the straightened iOrb, iCan, iCran, OC and OT sections were concatenated along the image centerline (e). The (b–d) sample sketches are simplified for illustrative purposes.

