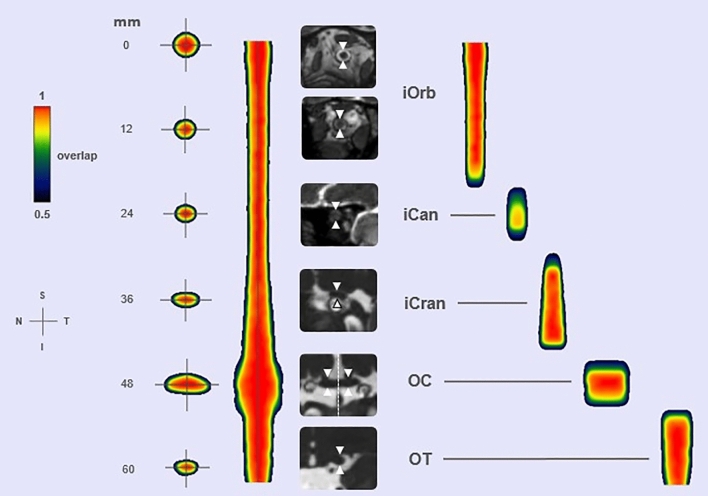
Figure 5.
The aVP-24 probabilistic atlas with its iOrb, iCan, iCran, OC and OT anatomical subdivisions seen as coronal (leftmost) and long-axis sections. The millimetre scale indicates the distance from the optic nerve head (which was set as the atlas origin), the color scale the spatial overlap between the 48 nerves: cooler colors indicate lower overlap while warmer colors greater overlap. White arrows highlight the aVP on illustrative coronal oblique CISS images for each corresponding subdivision of the aVP from one participant. The dashed line on the OC coronal image indicates the midline plane employed for splitting. Orientation marker abbreviations: I = inferior, N = nasal, S = superior, T = temporal.

