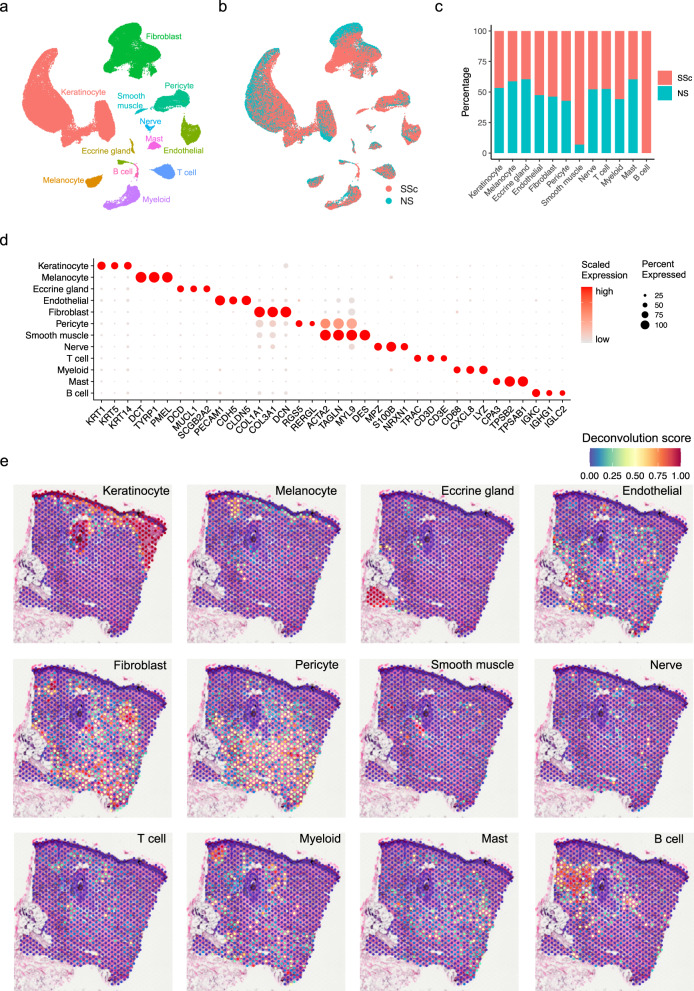
Fig. 1. Cell types observed in SSc skin and their spatial locations.
a UMAP plot showing 96,174 cells colored by cell types. b UMAP plot showing the cells colored by disease conditions. SSc systemic sclerosis, NS normal skin. c Bar plot showing the abundance composition across the disease conditions for each cell type in scRNA-seq. d Dot plot showing representative marker genes for each cell type. The color scale represents the scaled expression of each gene. The size of the dot represents the percentage of cells expressing each gene of interest. e Spatial plot showing the deconvolution score for each cell type. The coordinates of the spot correspond to the location in the tissue (spatial data representative of n = 4).

