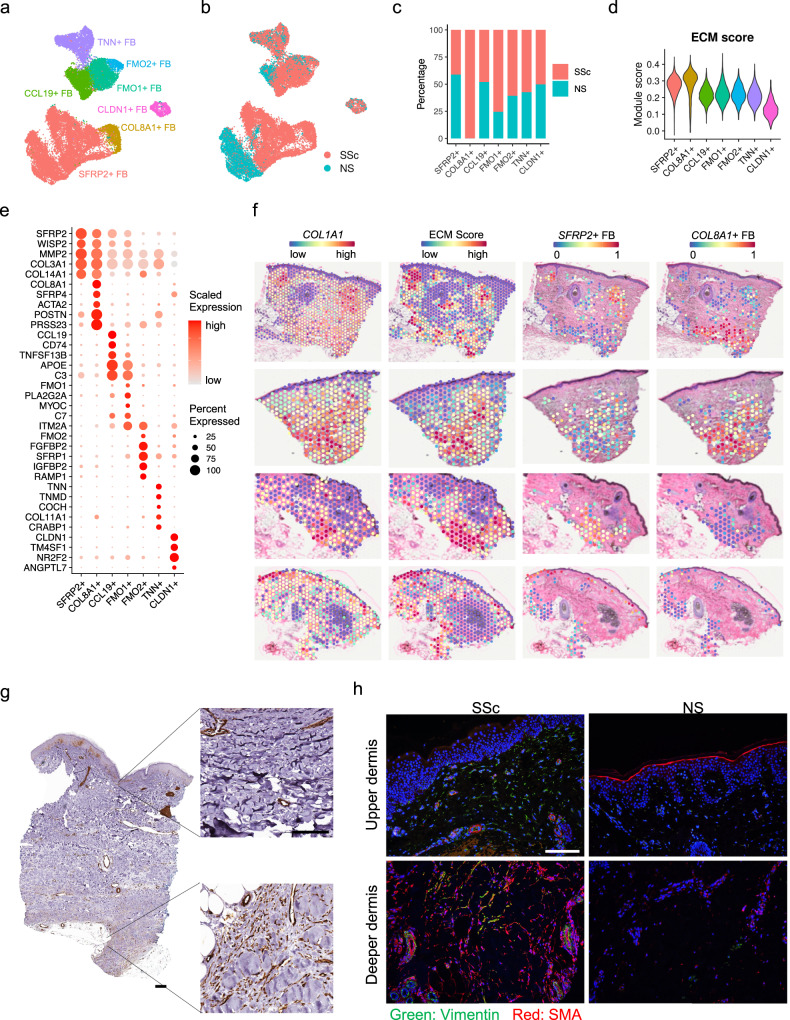
Fig. 2. Identification of fibroblast subtypes and their spatial locations.
a UMAP plot showing 25,182 fibroblasts colored by subtypes. b UMAP plot showing the fibroblasts colored by disease conditions. c Bar plot showing the abundance composition across the disease conditions for each fibroblast subtype. d Violin plot showing the extracellular matrix module scores in the fibroblast subtypes. e Dot plot showing the top marker genes for each fibroblast subtype. The color scale represents the scaled expression of each gene. The size of the dot represents the percentage of cells expressing the gene of interest. f The left two panels show the COL1A1 expression and extracellular matrix module score across all the spots in four spatial-seq samples. The right two columns show the deconvolution score for the SFRP2+ FB and COL8A1+ FB in the fibroblast-rich spots. g Immunohistochemistry staining for SMA in SSc skin tissue. The size bar represents 100 μm (staining is representative of n = 3). h Immunofluorescence showing the colocalization of Vimentin and SMA in the SSc and NS tissues (staining is representative of n = 3). The size bar represents 100 μm.

