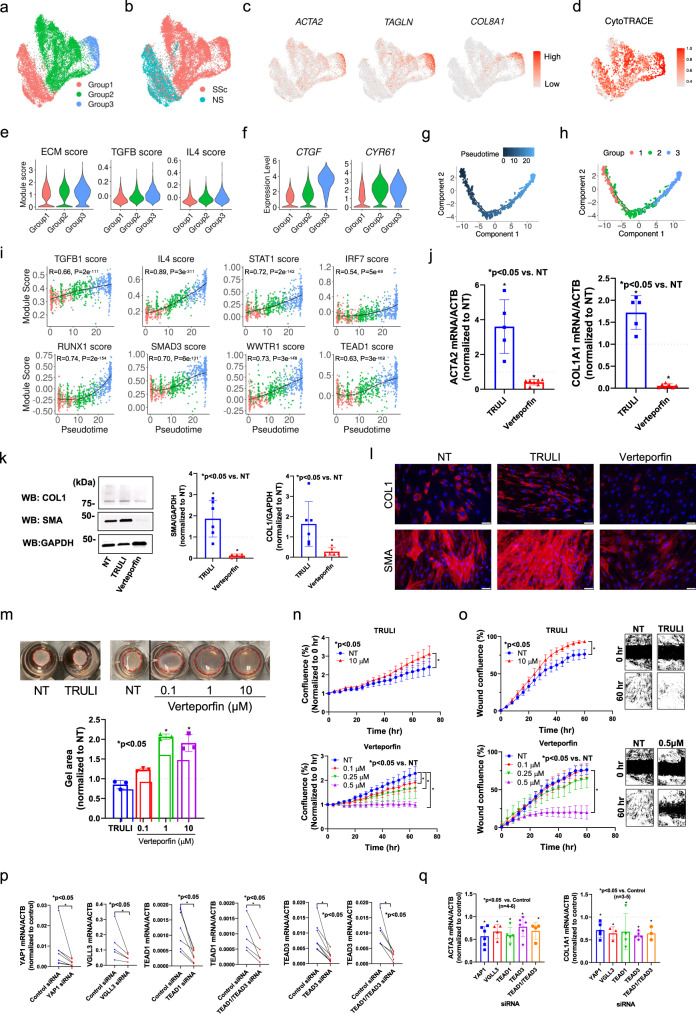
Fig. 3. Hippo pathway regulates myofibroblast differentiation in SSc skin.
a UMAP plot showing the SFRP2+ FB and COL8A1+ FB colored by groups. b UMAP plot showing the SFRP2+ FB and COL8A1+ FB colored by disease conditions. c UMAP plots showing the expression level of ACTA2, TAGLN and COL8A1 in the three fibroblast groups. d UMAP plot showing the CytoTRACE score in the three fibroblast groups. A higher CytoTRACE score suggests the cell being more differentiated. e Violin plots showing the extracellular matrix, TGF-β and IL-4 module scores in the three fibroblast groups. f Violin plots showing the expression level of CTGF and CYR61 in the three fibroblast groups. g Pseudotime trajectory colored by the pseudotime of the three fibroblast groups. h Pseudotime trajectory colored by the group identity of the three fibroblast groups. i Scatter plots showing the correlation between the fibroblast pseudotime and the target score or the upstream regulators. The color represents the group identity of the cell. Correlation test was applied. j Quantitative PCR results showing the effect of TRULI or verteporfin (both 10 μM) on ACTA2 and COL1A1 expression in dcSSc fibroblasts. Data normalized to NT. N = 5–7 patient lines. Data presented as mean +/− SD. Mann–Whitney test was applied. P < 0.05 was designated as statistically significant. p = 0.0079 for the TRULI groups, p = 0.0006 for the verteporfin groups. k Effect of TRULI or verteporfin (both 10 μM) on COL1 and SMA levels by Western blotting. Quantification of samples were from different blots, however the blots were processed in parallel and the data of each patient line is normalized to its own NT group. N = 5–6 patient lines. Data presented as mean +/− SD. Two-sided unpaired t-test was applied. P < 0.05 was designated as statistically significant. p = 0.035 for SMA-TRULI, p = 0.0001 for SMA-verteporfin, p = 0.0001 for COL1-verteporfin. l Immunofluorescence showing TRULI enhanced while verteporfin Inhibited COL1 and SMA expression in dcSSc fibroblasts. The size bar represents 50 μm. m TRULI enhanced while verteporfin blocked gel contraction in dcSSc fibroblasts. Data normalized to the corresponding NT group. N = 3 patient lines. Data presented as mean +/− SD. Kruskal–Wallis test or Mann–Whitney test was applied for verteporfin or Truli, respectively. P < 0.05 was designated as statistically significant. p = 0.019 and p = 0.049 for verteporfin 1 μM and 10 μM. n TRULI increased cell proliferation while verteporfin dose-dependently blocked cell growth. Cell proliferation was monitored by analyzing the occupied area by cells over time, using the IncuCyte S3 Analysis software. N = 3 patient lines. Data presented as mean +/− SEM. Two-way ANOVA test was applied. P < 0.05 was designated as statistically significant. P = 0.0001 for all significant groups. o TRULI enhanced cell migration while verteporfin blocked migration in a dose-dependent manner. Two-way ANOVA test was applied. N = 4 patient lines. Data presented as mean +/− SEM. P < 0.05 was designated as statistically significant. P = 0.0001 for all significant groups. p Extent of knockdown of genes relevant in the Hippo pathway in dcSSc fibroblasts. N = 5 patient lines. Two-sided paired t-test or Wilcoxon test was applied. P < 0.05 was designated as statistically significant. YAP1 siRNA: p = 0.016; TEAD1 siRNA: p = 0.0037; TEAD1/TEAD3 siRNA: p = 0.017 for TEAD1, p = 0.016 for TEAD3; TEAD3 siRNA: p = 0.0078. q Knockdown of genes involved in the Hippo pathway resulted in downregulation of ACTA2 and COL1A1. N = 4–6 patient lines. Two-sided unpaired t-test was applied. P < 0.05 was designated as statistically significant. Data presented as mean +/− SD. ACTA2: p = 0.0006 for YAP1 and TEAD1 siRNA; p = 0.0059 for VGLL3 siRNA; p = 0.031 for TEAD3 siRNA; p = 0.014 for TEAD1/TEAD3 siRNA. COL1A1: p = 0.0051 for YAP1 siRNA; p = 0.013 for VGLL3 siRNA; p = 0.0001 for TEAD3 siRNA, p = 0.013 for TEAD1/TEAD3 siRNA. Source data is provided for this figure.

