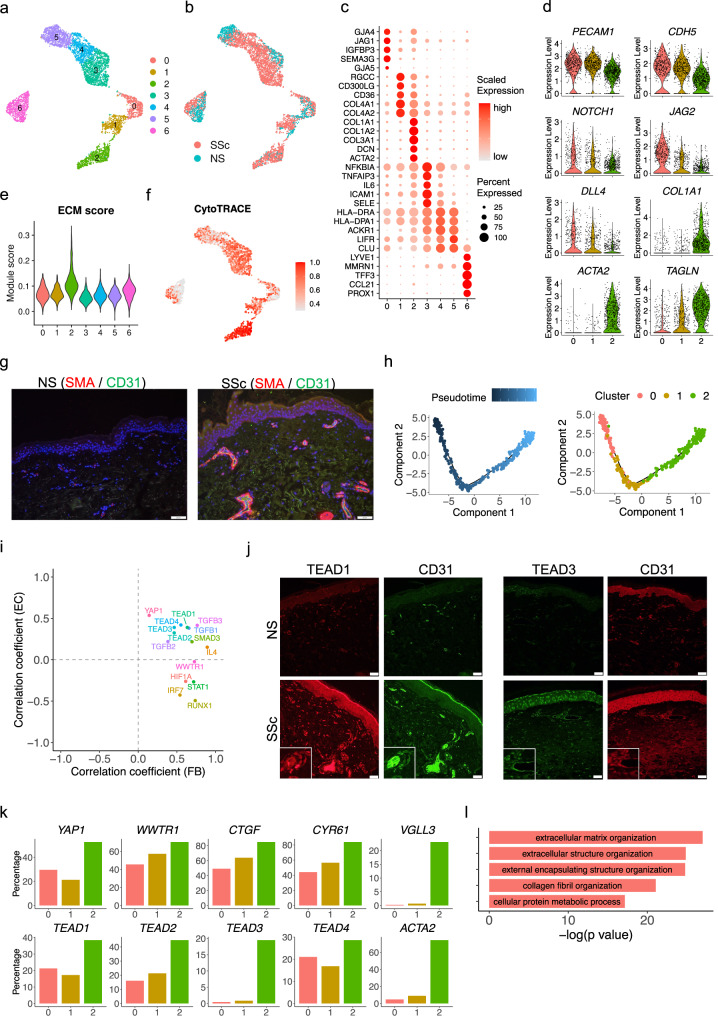
Fig. 4. Characterization of endothelial to mesenchymal transition in SSc skin.
a UMAP plot showing 5070 endothelial cells colored by sub-clusters. b UMAP plot showing the endothelial cells colored by disease conditions. c Dot plot showing the top marker genes for each endothelial sub-cluster. The color scale represents the scaled expression of each gene. The size of the dot represents the percentage of cells expressing the gene of interest. d Violin plots showing the expression level of representative genes in the endothelial sub-cluster 0, 1 and 2. e Violin plots showing the extracellular matrix module score in the endothelial sub-clusters. f UMAP plot showing the CytoTRACE score in the endothelial sub-clusters. A higher CytoTRACE score suggests the cell being more differentiated. g Immunofluorescence showing the colocalization of SMA and CD31 in the NS and SSc skin tissues. Images shown are representative of n = 3. The size bar represents 20 μm. h Pseudotime trajectory colored by the pseudotime (left) and sub-cluster identity (right) of three endothelial sub-clusters. i Scatter plot showing the correlation coefficients between the target score of the upstream regulators and the fibroblast pseudotime (X axis) and endothelial pseudotime (Y axis). j Immunofluorescence showing the colocalization of TEAD1/CD31 (left) and TEAD3/CD31 (right) in the NS and SSc skin tissues. Images shown are representative of n = 3. The size bar represents 20 μm. k Bar plots showing the percentage of cells expressing the gene in the endothelial sub-cluster 0, 1 and 2. l Bar plot showing the top five Gene Ontology pathways enriched for the 240 common up-regulated genes in fibroblast group 3 compared to group 1, 2 and endothelial sub-cluster 2 compared to sub-cluster 0, 1.

