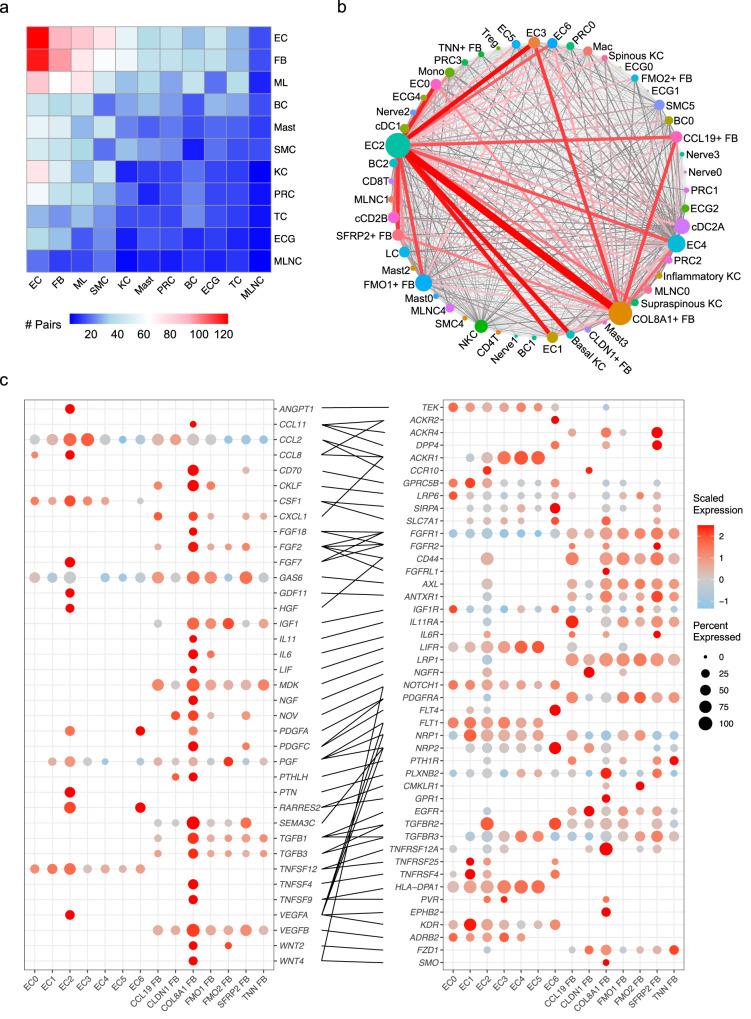
Fig. 6. Myofibroblasts and EndoMTs act as central hubs in cell-cell communications.
a Heatmap showing the number of ligand-receptor pairs with interaction scores higher in SSc compared to NS. Row, cell type expressing the ligand; column, cell type expressing the receptor. Color scale, number of ligand-receptor pairs. EC endothelial cell, FB fibroblast, ML myeloid cell, BC B cell. Mast mast cell, SMC smooth muscle cell, KC keratinocyte, PRC pericyte. TC T cell, ECG eccrine gland cell, MLNC melanocyte. b Connectome web analysis of interacting subtypes in the SSc samples. Vertex (colored cell node) size is proportional to the number of interactions to and from that cell type, whereas the thickness of the connecting lines is proportional to the number of interactions between two nodes. c Dot plots showing expression of the ligands (left) and receptors (right) in endothelial and fibroblast subtypes in the SSc samples. Color scale indicates the level of expression in positive cells, whereas dot size reflects the percentage of cells expressing the gene.

