Figure 5.
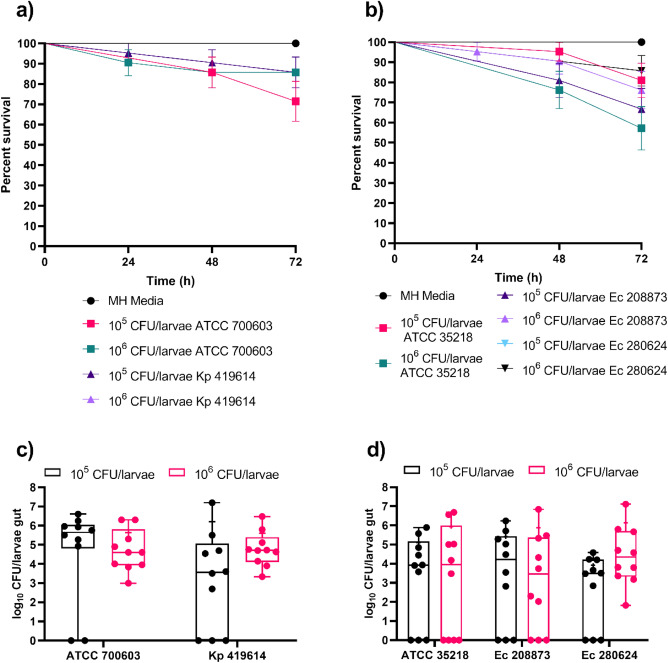
Survival curve of colonized larvae (a) and CFU counts 48 h after the last force feeding of the larvae gut colonized with K. pneumoniae ATCC 700603 and Kp 419614 (c). Survival curve of colonized larvae (b) and CFU count after 48 h of last force feeding of the larval gut colonized with E. coli ATCC 35218, isolates Ec 208873 and Ec 280624 (d). Larvae were colonized with 105 and 106 CFU/larvae bacterial doses of K. pneumoniae and E. coli strains (a,b). Three-force feedings were performed, and survival was observed every 24 h. The experiment was repeated three times (6 × 2 + 9 × 1 = 21), and the data were analyzed with the log-rank (Mantel–Cox) test (the results are presented in Table S1). The error bars represent the standard error (SE). Larvae were divided into groups based on the bacterial dose applied to the larvae via force feed (c,d). After 48 h of gavage, the larval guts were isolated. MacConkey agar was used for selection of Gram-negative bacteria. The experiment was performed twice, with five larvae per group (n = 10). The boxes represent 75th percentiles, the whiskers represent the minimum to maximum, the line represents the median, + represents the mean and the dots represent all the data points.

