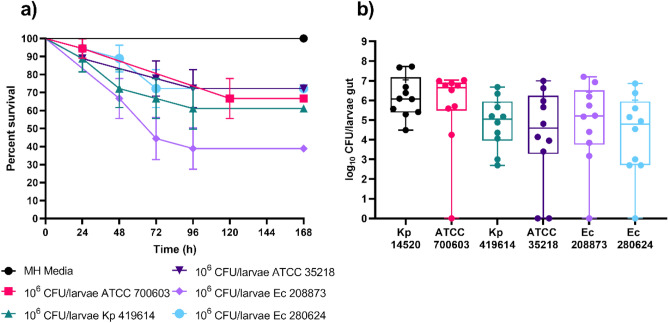
Figure 6.
Survival curve of larvae colonized (a) and CFU count after 120 h of last force feeding (b) of the larval gut colonized with K. pneumoniae and E. coli strains. Larvae were colonized with 106 CFU/larvae bacterial dose. Larvae were force-fed three times and monitored for survival every 24 h. The experiment was repeated three times (6 × 3 = 18), and the data were analyzed with the log-rank (Mantel–Cox) test (results are depicted in Table S1). The error bars represent the standard error (SE). Larvae were divided into different groups based on the force-fed to the larvae (b). After 120 h of last force-feeding, the larval gut was isolated and plated for CFU counting on MacConkey agar. The experiment was performed twice, with five larvae per group (n = 10). The boxes represent the 75th percentile, the whiskers represent the minimum and maximum values, the line represents the median, the + represents the mean and the dots represent all the data points.

