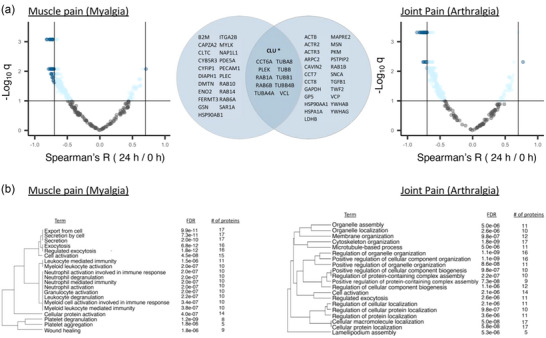
FIGURE 9.

Associations between changes in the post‐exercise EV proteome and average severity of ME/CFS symptoms myalgia and arthralgia. (a) Volcano plots showing correlations between the initial specific symptom severity (SSS) scores of muscle tenderness and pain (myalgia) and joint pain (arthralgia) and within‐subject 24 h/0 h ratios for each protein. For initial SSS scores, subjects were asked to rate their average symptom severity over the last month. The x‐axis shows the Spearman's correlation coefficient R, with vertical solid lines indicating R = ‐ 0.7 and R = 0.7. The y‐axis shows the negative log of the q‐value, with horizontal solid line indicating q < 0.1. The dark blue dots show proteins with |R| > 0.7 and q < 0.1, and light blue dots show the remaining proteins with q < 0.1. The Venn diagram shows the 32 and 34 proteins correlating at |R| > 0.7 and q < 0.1 with myalgia and arthralgia, respectively, with 11 being common to both. CLU* is the only protein with a positive correlation. (b) Pathway enrichment analysis of the 32 and 34 proteins displayed as hierarchical clustering dendrograms with the top 20 enriched pathways. Pathways with many shared proteins are clustered together. FDR and number of proteins belonging to each term are shown.
