
FIGURE 11.
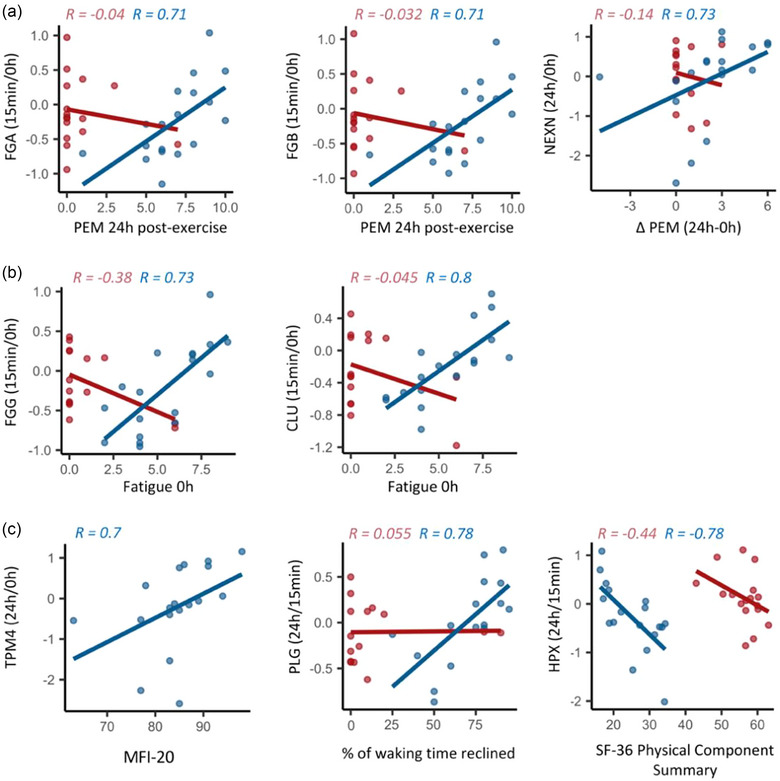
Associations between changes in the post‐exercise EV proteome and (a) post‐exertional malaise severity, (b) fatigue severity the day of exercise and (c) metrics of overall disease severity, including the MFI‐20, the percentage of waking time spent reclined and the SF‐36 Physical Component Summary. Each dot is one subject. The lines are linear regression lines and Spearman's R are shown on each plot for controls (red) and ME/CFS patients (blue). All correlations presented are significant in ME/CFS patients (q < 0.1).