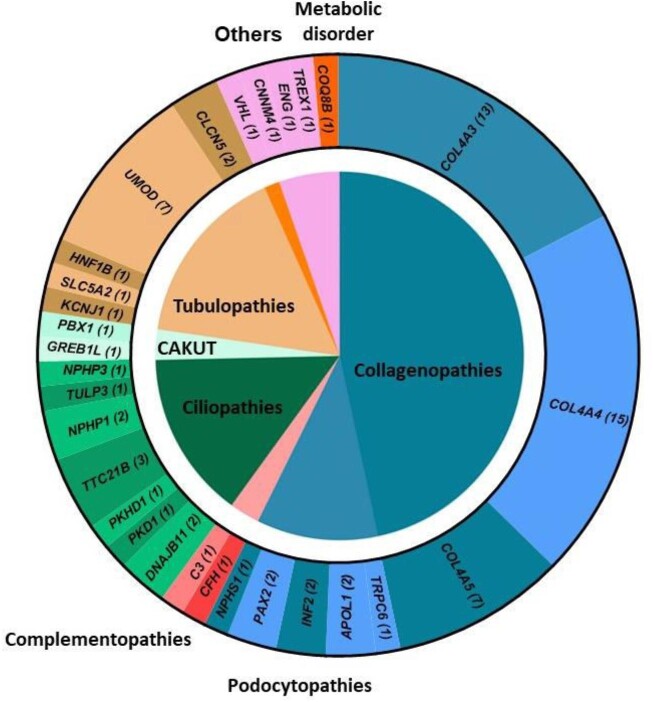
Figure 2:
Gene-associated kidney disease according to the category of genetic kidney disease. The inner circle represents the categories of genetic kidney disease and in the outer circle, gene reported with a pathogenic variant in patients; numbers in brackets represent the number of patient's carrier. Genes have been clustered according to their associated categories of genetic kidney disease.

