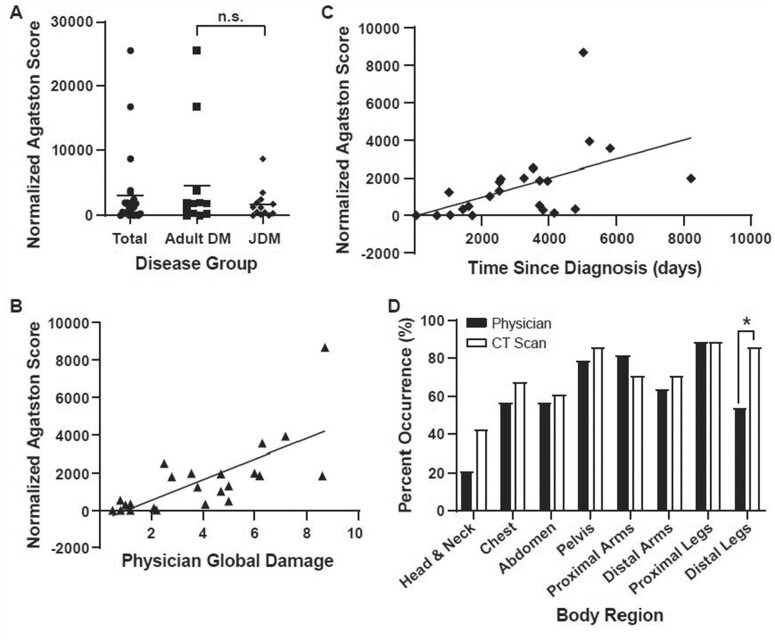
Figure 3.
Calcium score by disease group, clinical metrics and detection between CT and physical examination. (A) Comparison of the height normalized calcium score (Agatston) across adult DM and JDM disease, W value = 0.644, n.s. (B) Height normalized calcium score (Agatston/cm) against physician measure of disease damage, Spearman: r = 0.80, P < 0.001. (C) Height normalized calcium score (Agatston/cm) against date of diagnosis to date of scan, Spearman: r = 0.69, P = 0.001. (D) Differences in calcinosis detection by body region across the cohort, Kappa = 0.45, Fisher’s Exact: *P < 0.05; Distal legs

