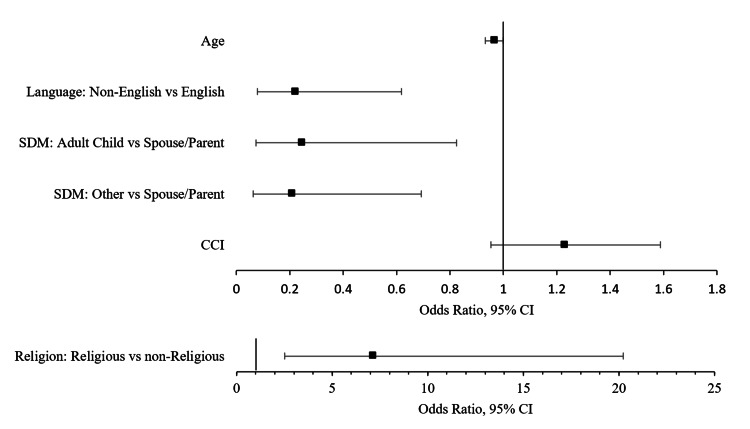
Figure 1. Model 1 forest plot of logistic regression output for neurosurgery patients accepting PC.
PC: palliative care; SDM: surrogate decision-maker: CCI: Charlson Comorbidity Index; GCS: Glasgow Coma Scale
Religion was plotted in a separate forest plot for clarity using a different axis scale. Significant predictors include age (OR=0.965, p=0.049), non-English (OR=0.219, p=0.004), adult child SDM (OR=0.246, p=0.023), other relative/friend SDM (OR=0.208, p=0.011), and religious (OR=7.132, p<0.001).

