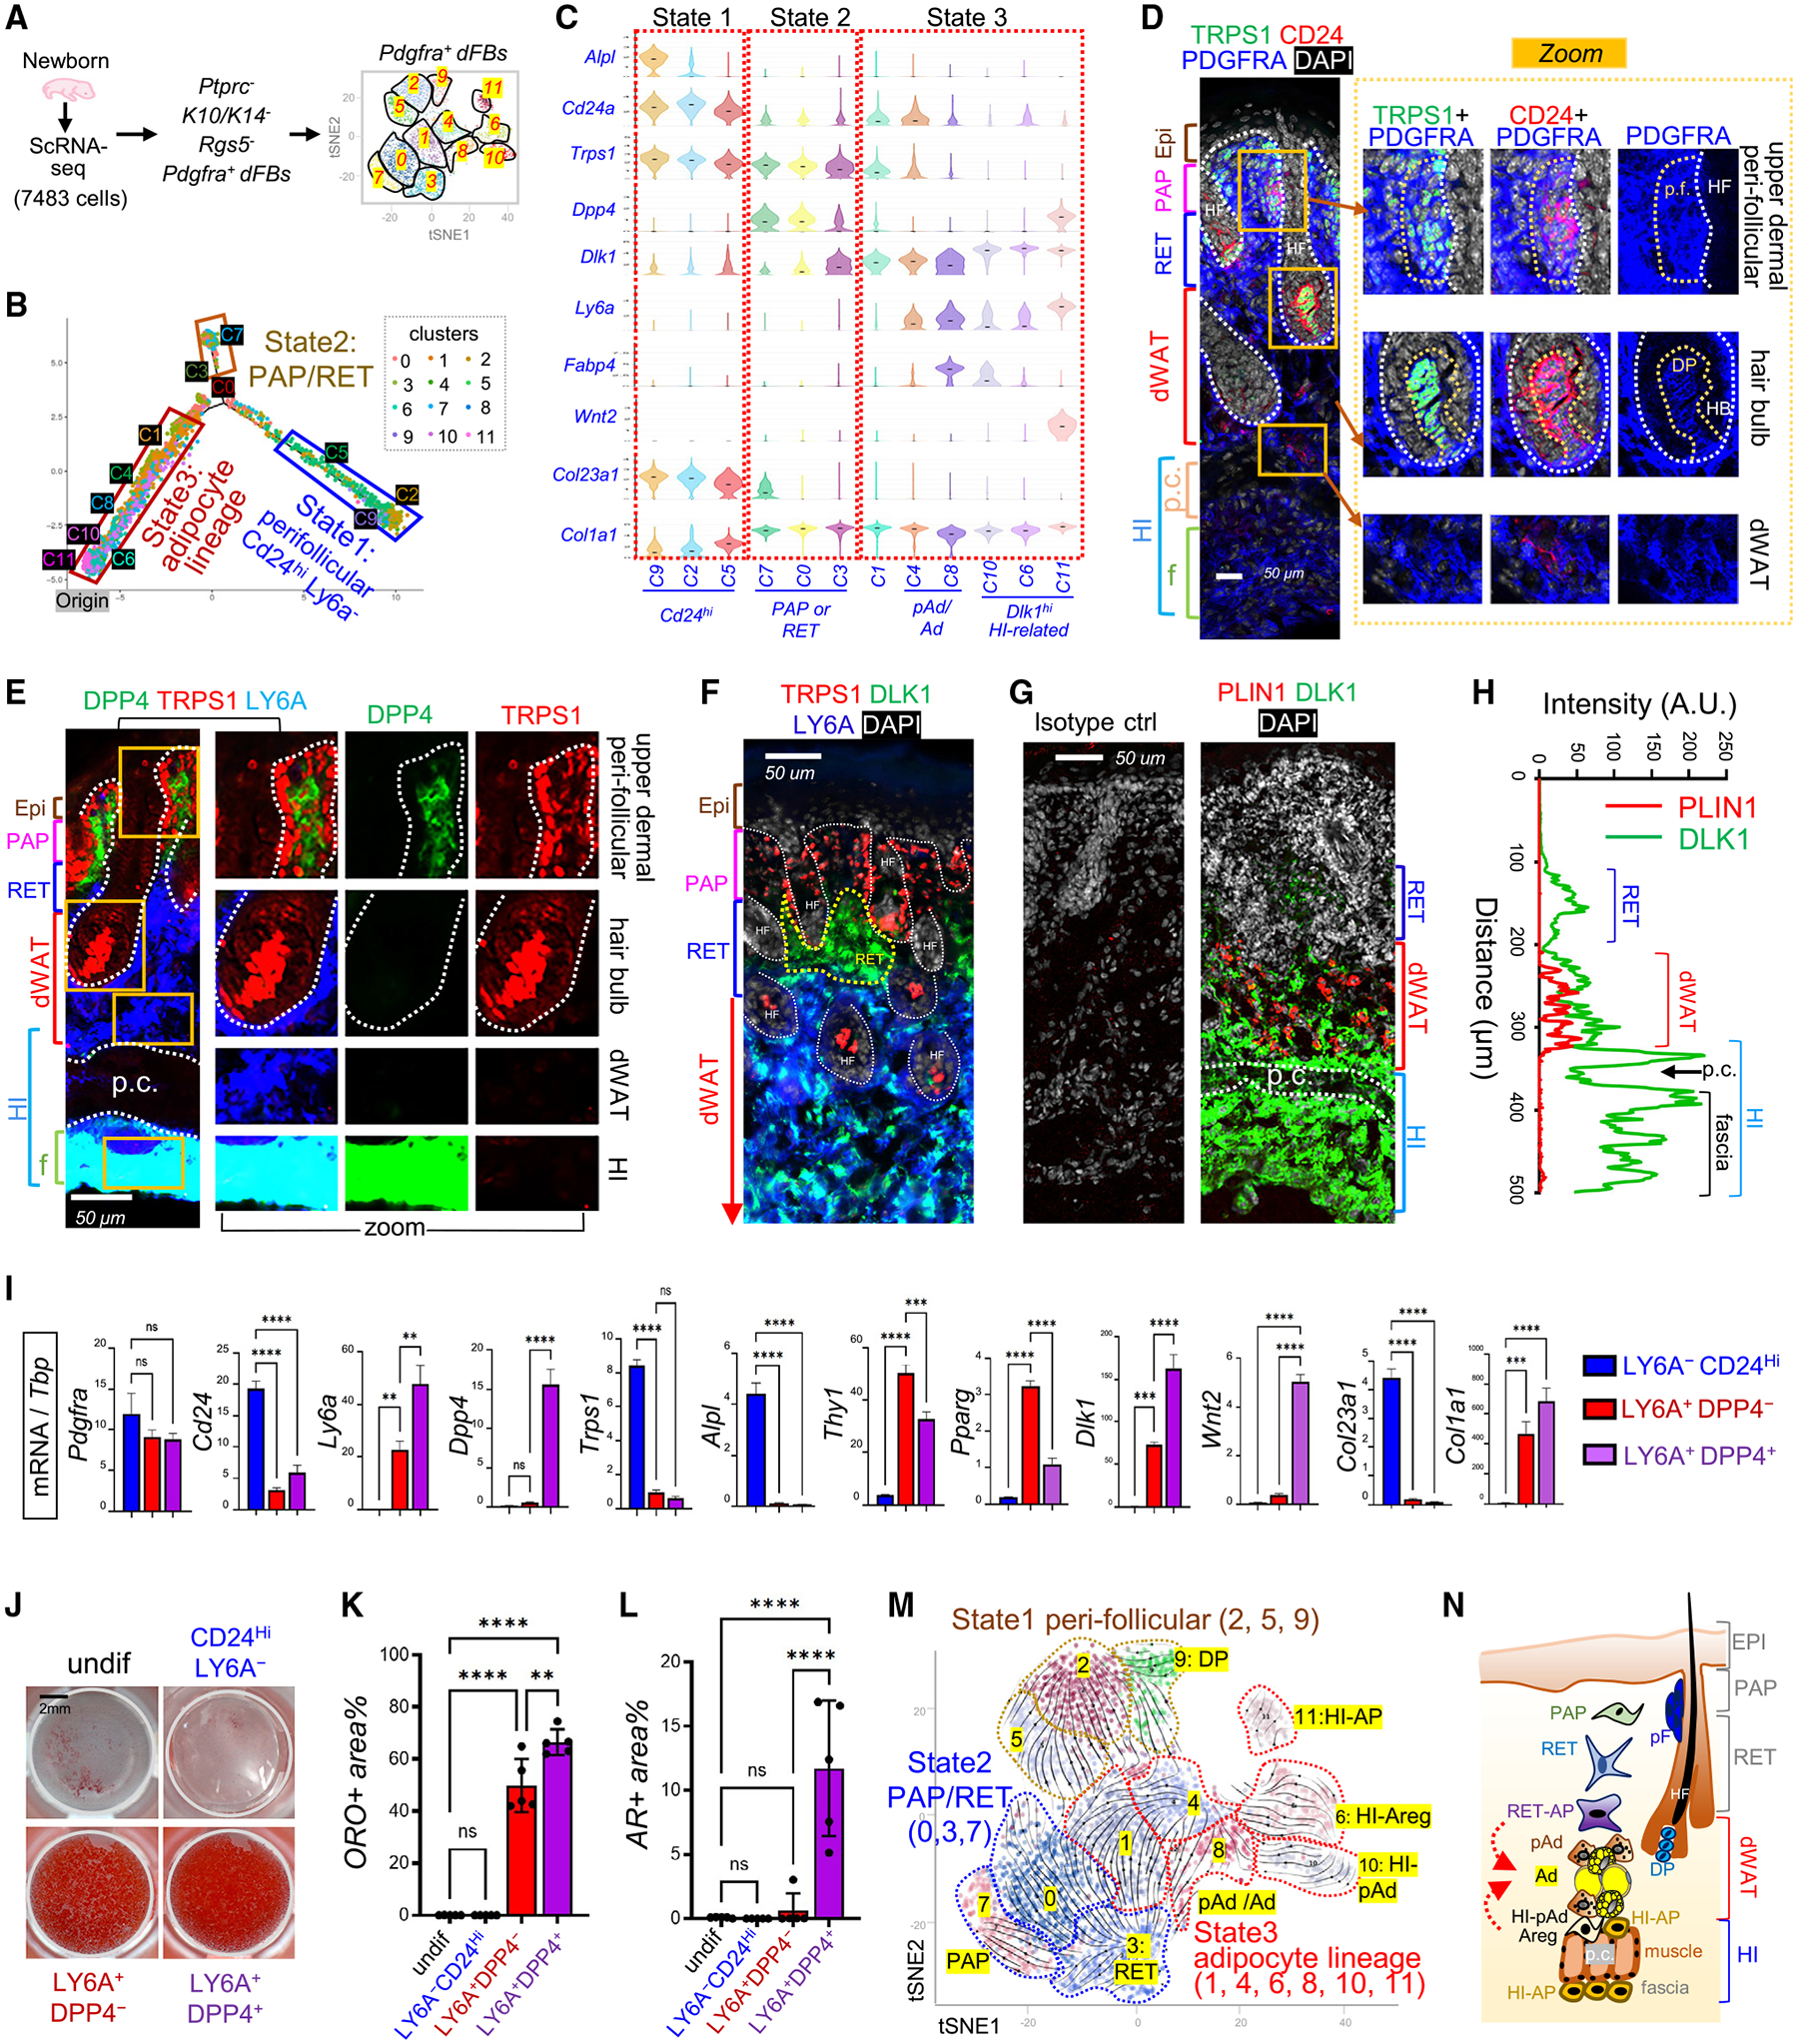
Figure 1. Characterization of heterogeneous dermal adipocyte lineage cells in developing neonatal skin.

(A) scRNA-seq analysis of cells isolated from neonatal skin. Pdgfra+ dFBs were reclustered into 12 clusters.
(B) Neonatal dFBs were grouped into three cell states along differentiation trajectories.
(C) Violin plots of indicated genes.
(D–G) Neonatal mouse skin sections were immunostained with antibodies against various dFB markers as indicated, and the nuclei were counterstained with DAPI in either blue or white. Scale bars, 50 μm. Abbreviations: p.c., panniculus carnosus muscle layer; p.f., perifollicular; DP, dermal papilla; HF, hair follicle; HB, hair bulb. Brackets show specific anatomical skin layers as indicated.
(H) Quantified result of (G) showing the fluorescence intensity (arbitrary unit, A.U.) of PLIN1 (red) and DLK1 (green) across skin section from top to bottom.
(I–L) Perifollicular dFBs (CD24hiLY6A−), pAds (DPP4−LY6A+), and HI-APs (DPP4+LY6A+) were sorted and then subjected to qRT-PCR analysis (n = 3/group) of indicated genes (I) or in vitro adipocyte differentiation for adipocytes (stained with oil red O [ORO]) (J). Quantified ORO+ area for each group is shown in (K) (n = 5/group). Sorted cells were also subjected to osteocyte differentiation (stained with alizarin red [AR]; see Figure S1V), and quantified AR+ area is shown in (L) (n = 5/group). Scale bar, 2 mm. All error bars indicate mean ± SEM; **p < 0.01, ***p < 0.01, ****p < 0.0001.
(M) RNA velocity analysis overlaid on tSNE projection of developing dFBs.
(N) A model for the proposed spatial location of various dFB subpopulations in the developing skin. Abbreviations: PAP, papillary dFBs; RET, reticular dFBs; RET-AP, reticular adipocyte progenitors; pAd, preadipocytes; Ad, adipocytes; HI-pAd, hypodermal interstitial pAd; HI-AP, hypodermal interstitial AP.
