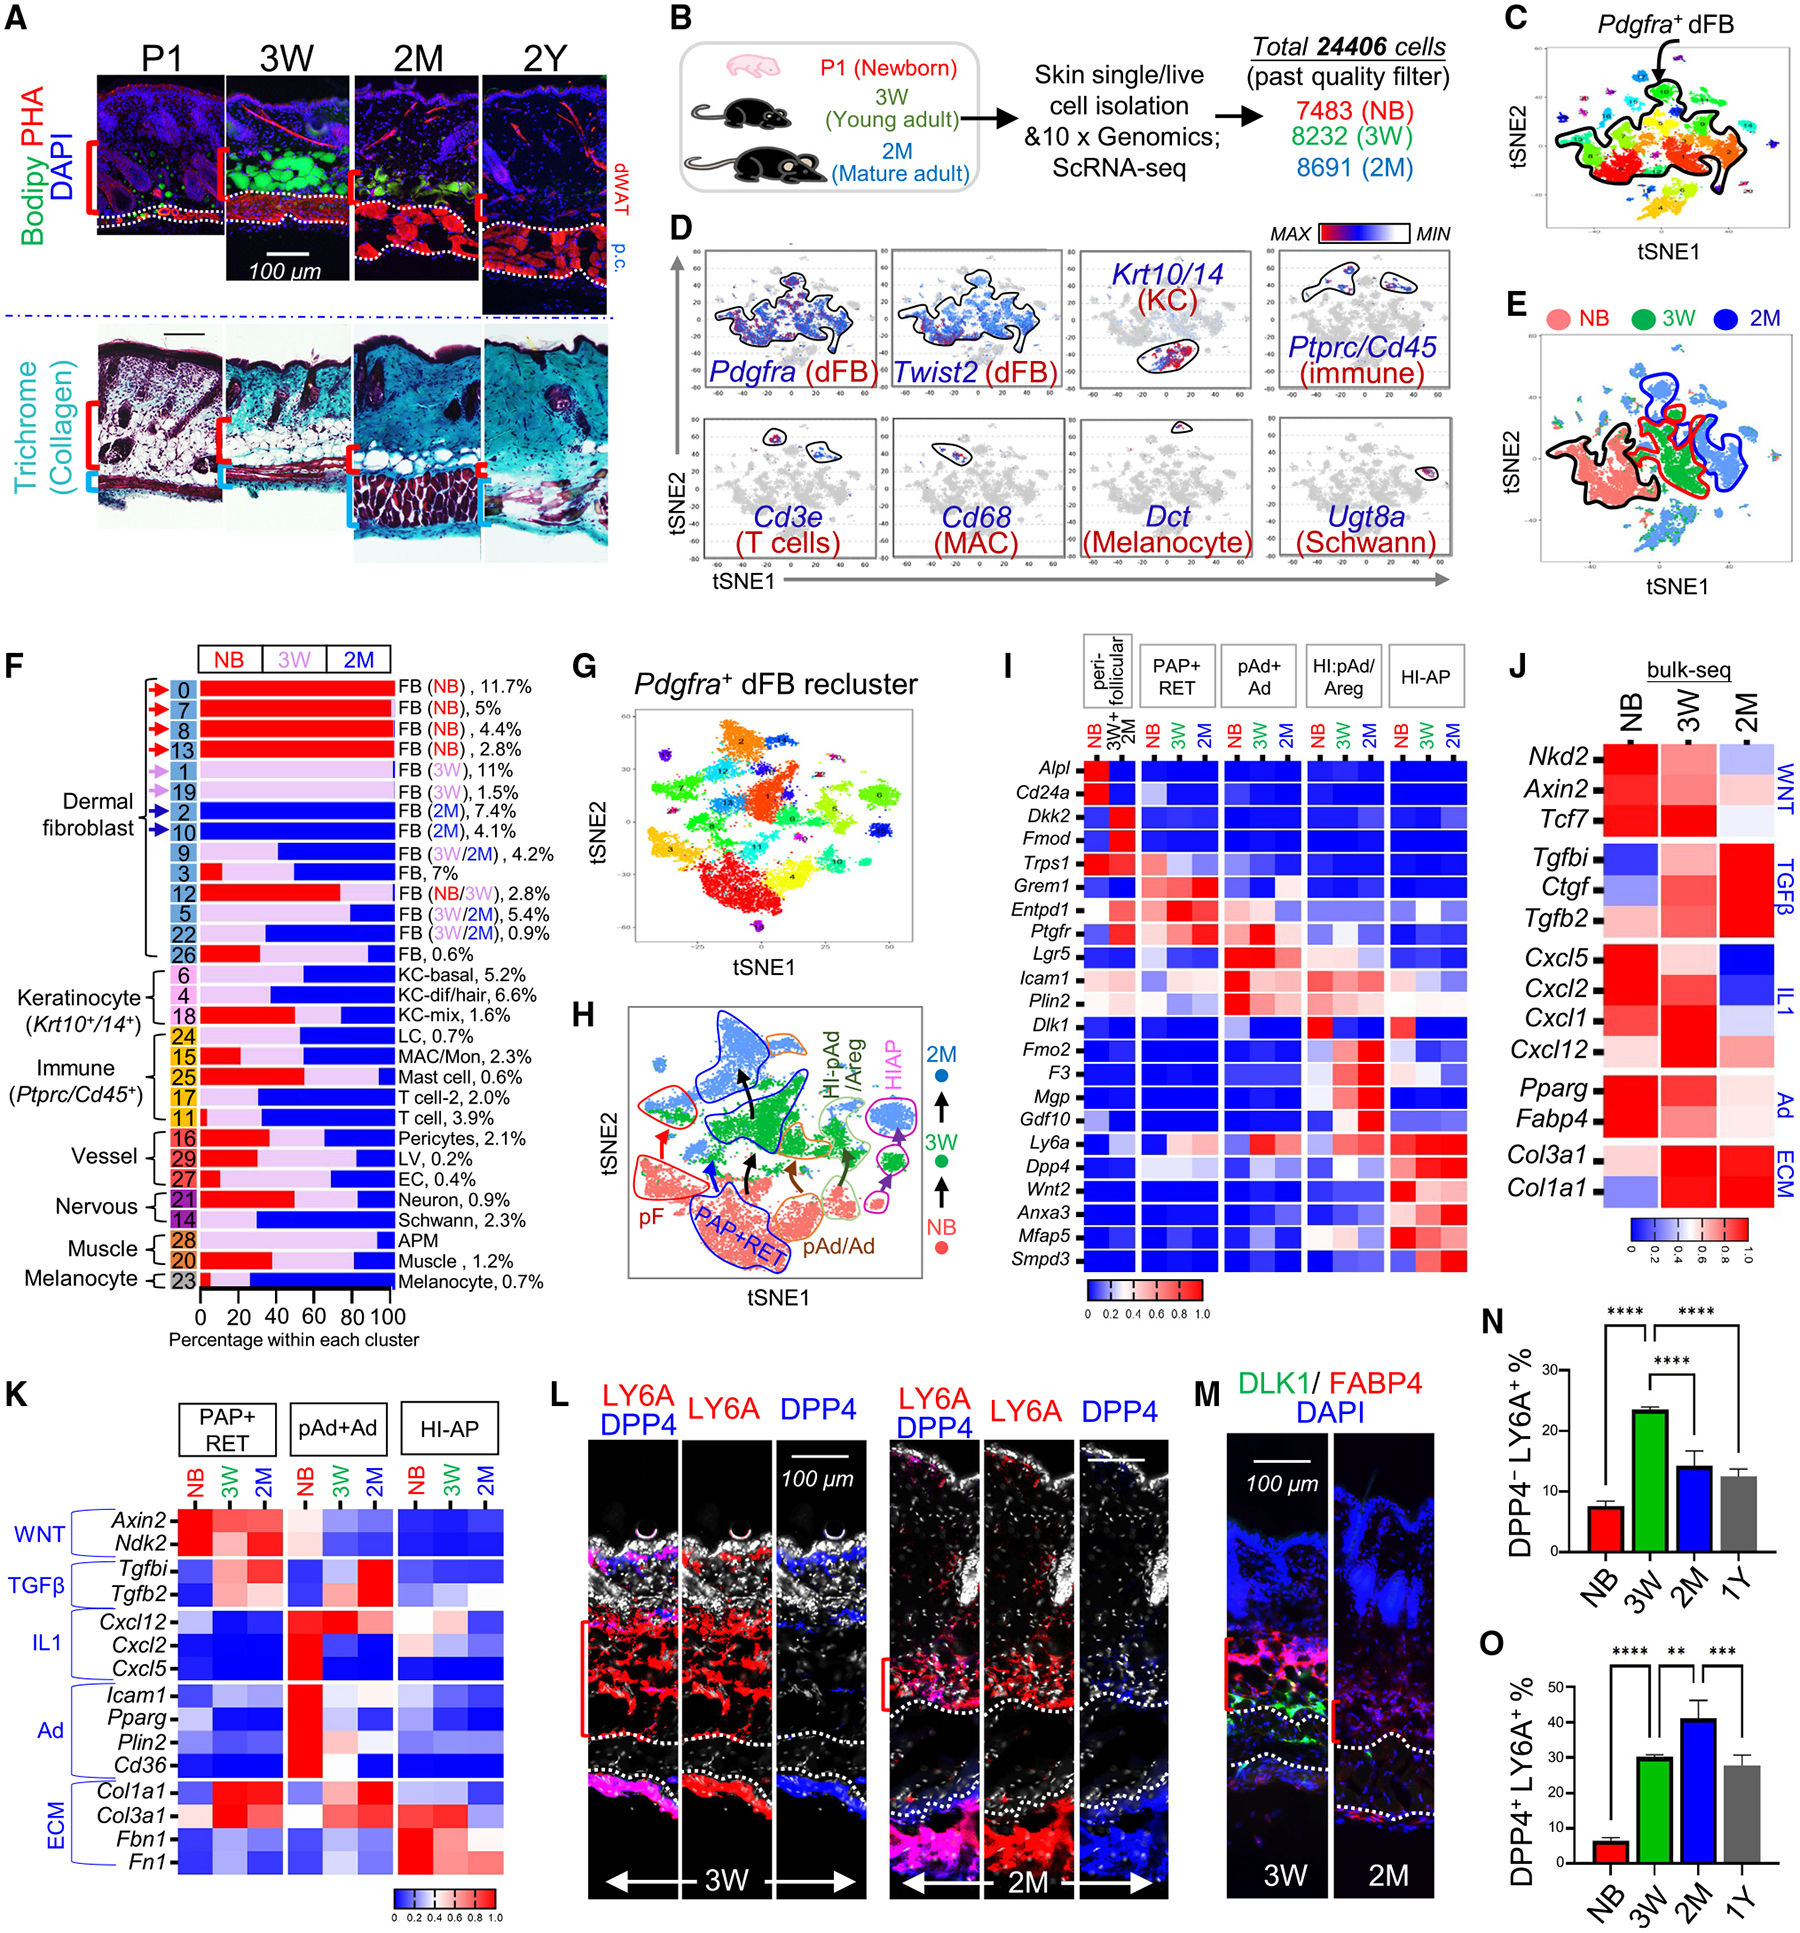
Figure 3. Tracing dermal adipogenesis and fibrogenesis during skin maturation.

(A) BODIPY (green dye for lipid) and phalloidin (red dye for actin fiber) staining (top) and Gomori trichrome staining (bottom) of skin sections from mice at indicated ages. Scale bar, 100 μm
(B) Schematic of scRNA-seq of dorsal skin cells isolated from NB, 3-week, and 2-month mice.
(C) tSNE plots showing cell distribution by clusters indicated with unique color.
(D) tSNE plots showing the expression of indicated marker genes.
(E) tSNE plots showing cell distribution by age of NB (red), 3-week (green), and 2-month (blue) mice.
(F) Bar chart showing age-related changes in the percentage of various cell types.
(G–I) Pdgfra+ dFBs were reclustered into tSNE plots by cluster (G) or by age (H). Age-related changes in the expression of the indicated genes are shown by heatmap (I).
(J) Heatmap showing the mRNA expression (based on bulk RNA-seq) of the listed genes in mouse skin at the indicated ages.
(K) Heatmap showing age-dependent kinetics of the expression of the listed genes in the indicated dFB clusters.
(L and M) Skin sections from mice at 3 weeks or 2 months of age were immunostained with antibodies against the indicated dFB/AD markers. Scale bars, 100 μm.
(N and O) Quantified bar graphs of FACS plots in Figure S3G showing the percentage of DPP4−LY6A+ pAds (N) or DPP4+Ly6A+ HI-APs (O) in CD31−CD45−PDGFRA+ dFBs (n = 3/group). All error bars indicate mean ± SEM; **p < 0.01, ***p < 0.001, ****p < 0.0001.
