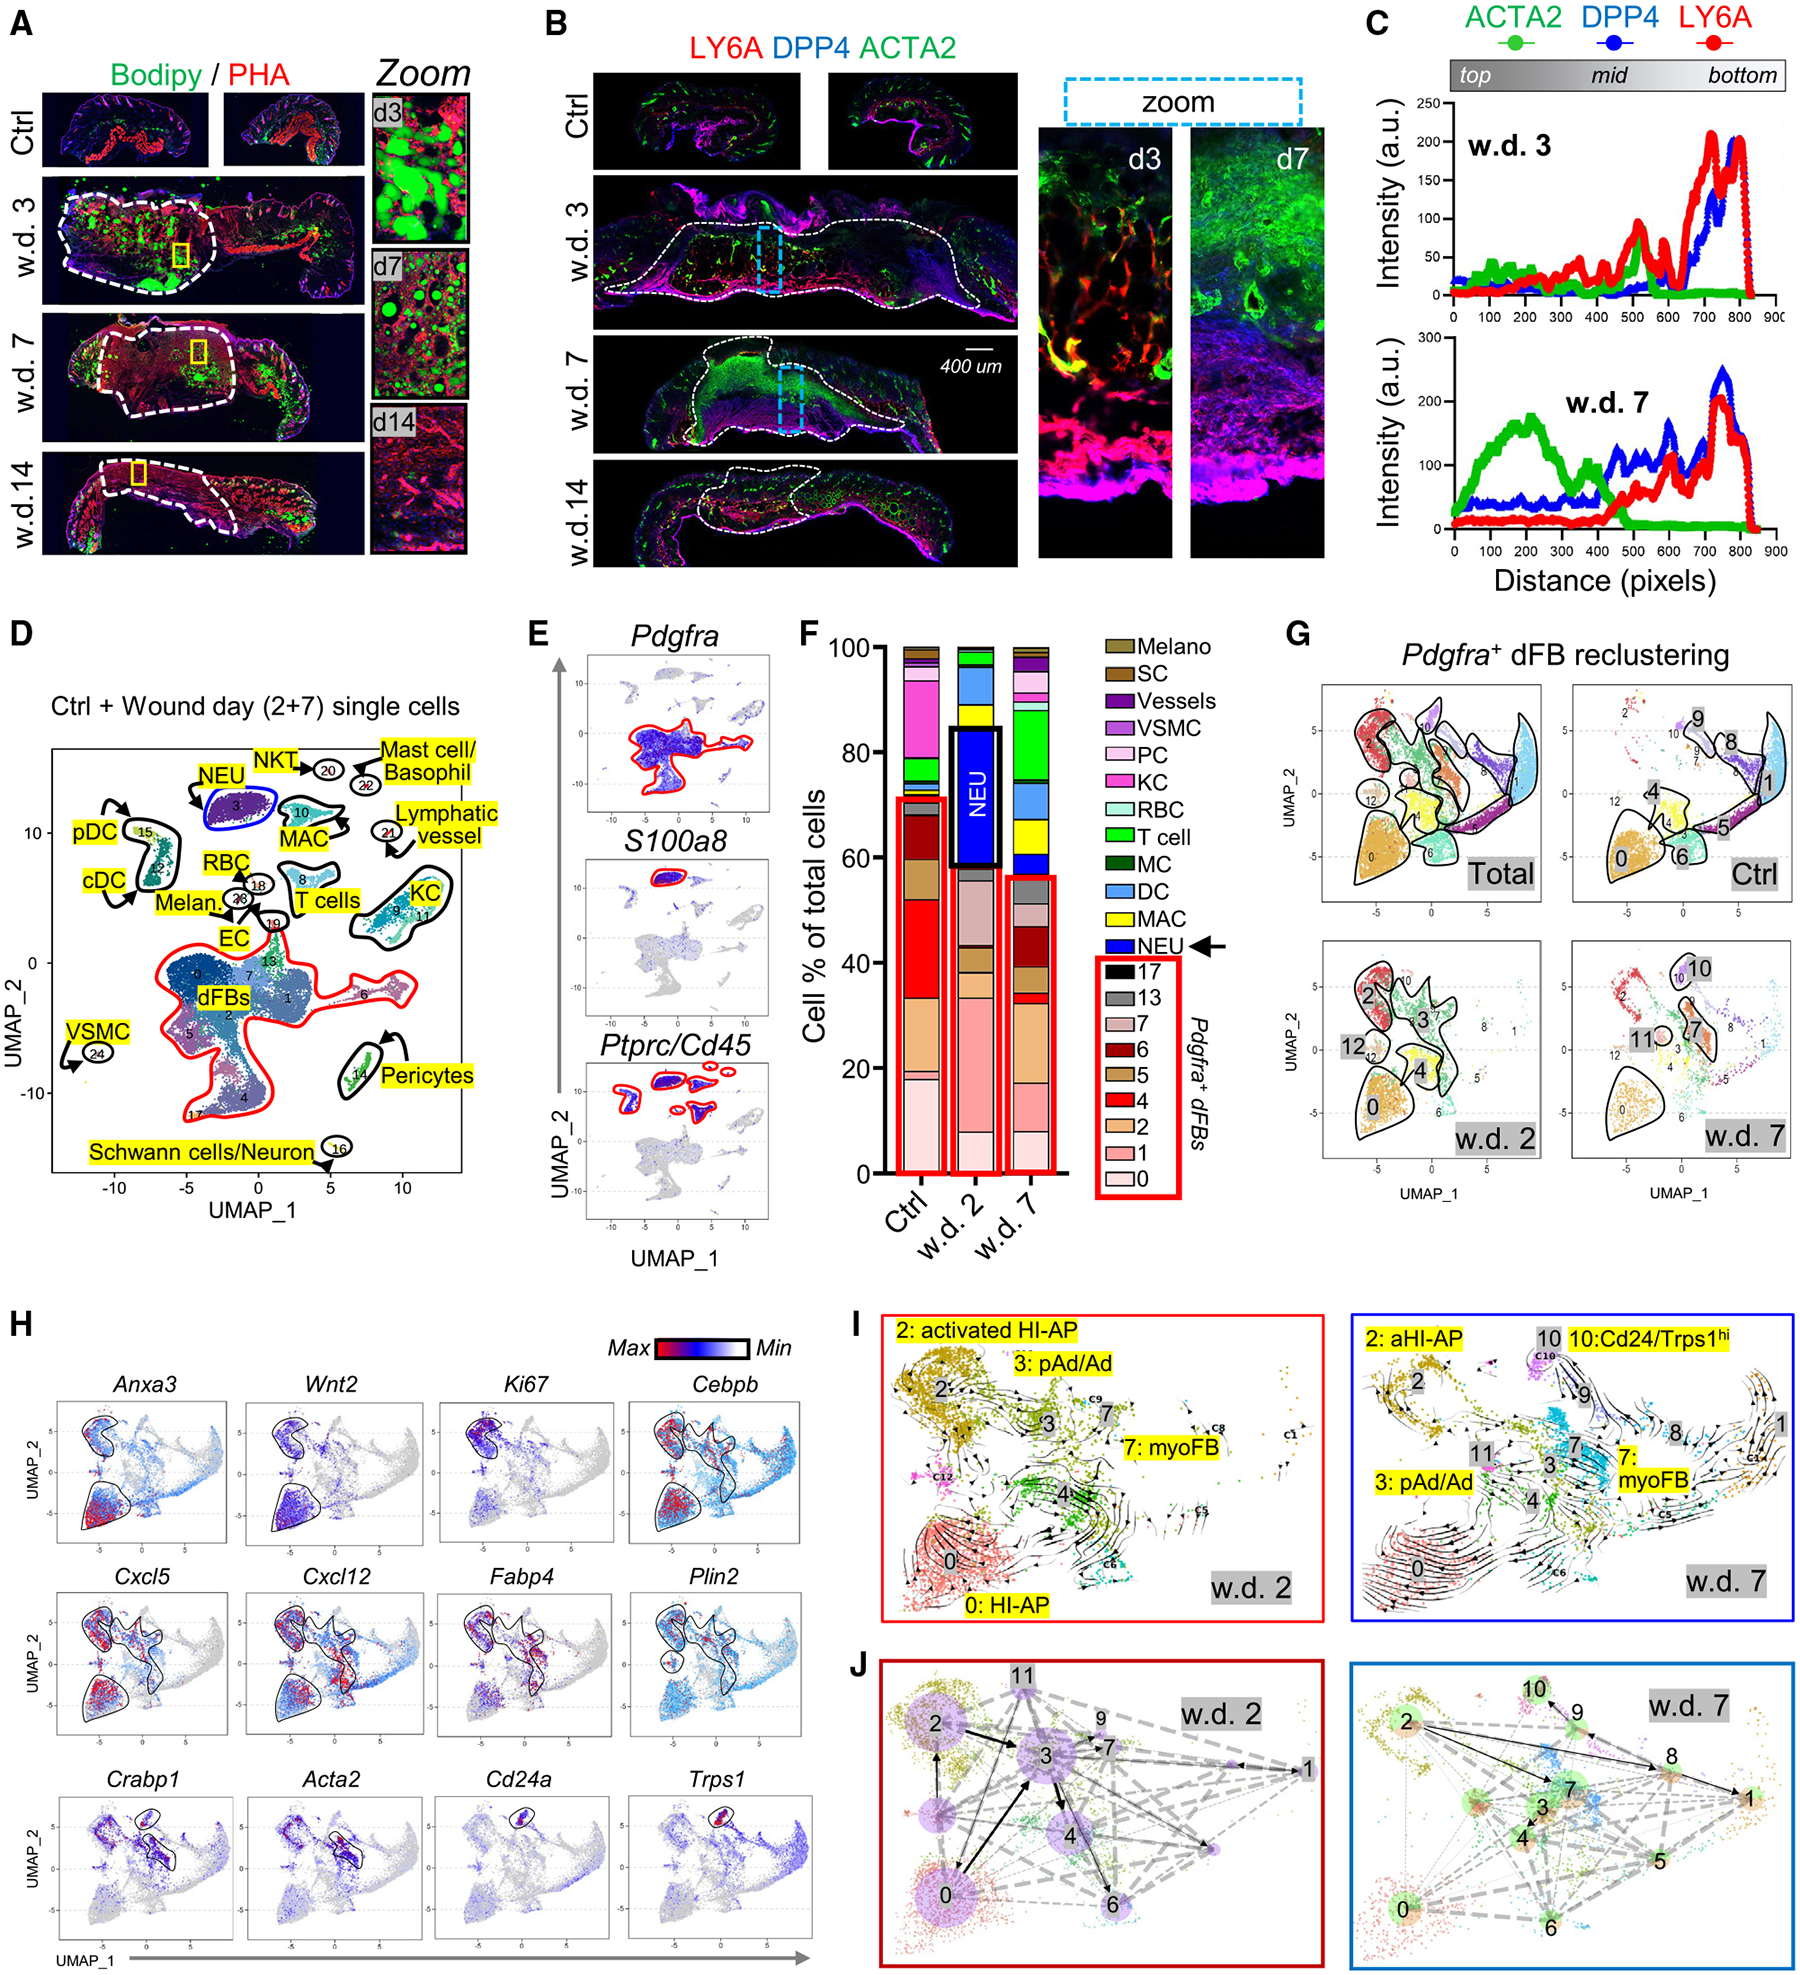
Figure 4. Tracing dermal adipogenesis and fibrogenesis during skin wound healing.

(A) Full-thickness mouse wounds were collected at indicated wound days (w.d.) for PHA (red) and BODIPY (green) staining. The dotted lines mark wound central granular tissues. Scale bar, 400 μm.
(B) LY6A (red), DPP4 (blue), and ACTA2 (green) immunostaining. Dotted lines mark wound GT. Scale bar, 400 μm.
(C) Quantified intensity profiles for (B), showing signals from all three fluorescence channels from wound top to bottom (representative of n = 3/group).
(D–F) Wound day 2 and 7 and unwounded control skin samples were subjected to scRNA-seq analysis. UMAP (uniform manifold approximation and projection) plot (D) showing cell distribution by clusters. UMAP plots (E) showing the expression of indicated marker genes for each cluster. Stacked bar graphs (F) showing the percentage of each cell cluster.
(G and H) Pdgfra+ dFBs were reclustered. UMAP plots (G) showing cell cluster distribution in different samples. UMAP plots (H) showing the expression of indicated marker genes.
(I and J) RNA velocity analyses (I) and cell rank analyses (J) were mapped onto the UMAP plot of dFB reclusters of w.d. 2 or 7 samples as indicated.
