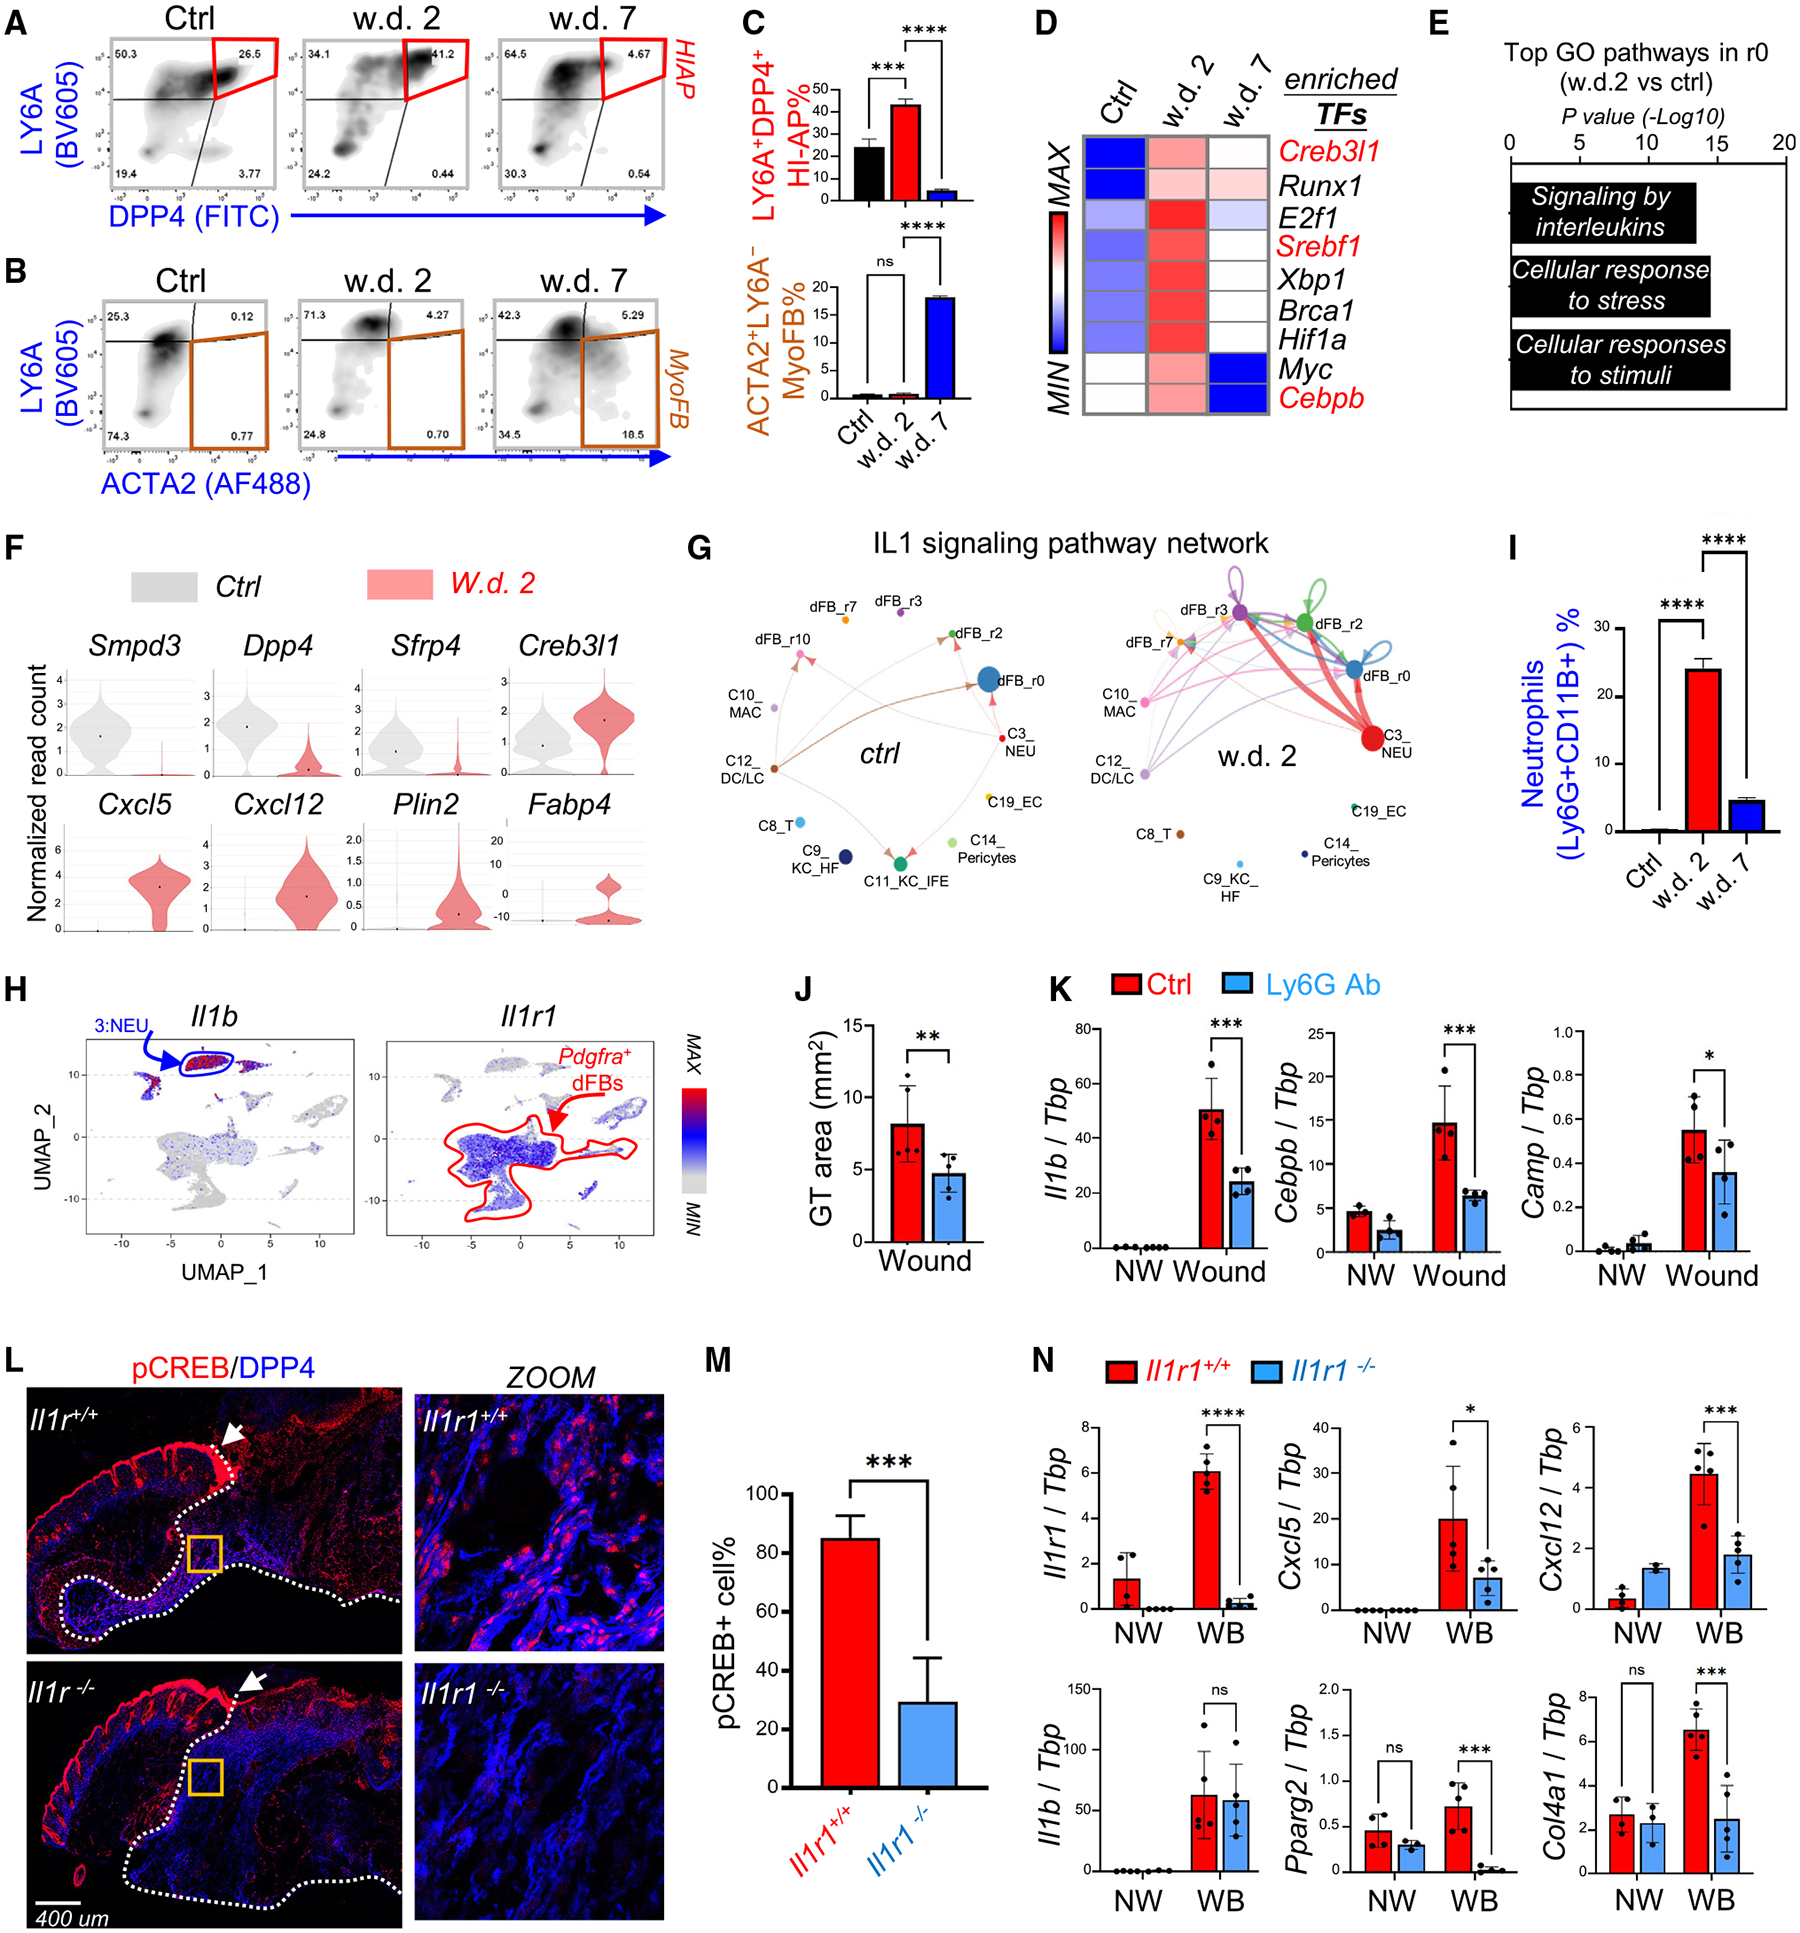
Figure 5. Wound-induced adipogenesis is regulated by neutrophils and the IL-1 signaling axis.

(A–C) FACS plots (A and B) and quantified bar graphs (C) showing the percentage of HI-APs (DPP4+LY6A+) and myofibroblasts (ACTA2+LY6A−) in control, w.d. 2, and w.d. 7 skin samples (n = 3/group).
(D) Heatmap showing the top enriched transcriptional factors in w.d. 2 cells compared with control and w.d. 7 cells.
(E) KEGG/GO pathway analysis comparing the r0 HI-AP cluster of control and w.d. 2 skin samples showing top enriched signaling pathways activated in HI-APs after wounding.
(F) Violin plots showing the expression of indicated genes in the control and w.d. 2 samples.
(G) Circle plot showing the inferred intercellular communication network for IL-1β signaling in control and w.d. 2 skin cells.
(H) UMAP plots showing the expression of indicated genes in total wound cell clusters.
(I) Quantified bar graphs (from FACS plots shown in Figure S5G) showing neutrophils (Ly6G+CD11B+)% (n = 3/group).
(J and K) Mice were injected intraperitoneally with isotype (Ctrl) or anti-Ly6G antibodies to deplete neutrophils and then skin wounds were collected at w.d. 3 for granular tissue (GT) area measurement (J). qRT-PCR analysis (K) of the listed genes (n = 4/group).
(L and M) Wound samples were collected from WT or Il1r1 knockout mice at w.d. 3 for immunostaining (L) of pCREB (red) and DPP4 (blue), and quantified percentage of pCREB+ cells is shown in (M) (n = 7–10/group). In (L), the white dotted line marks the granule tissue and arrow points to the unaffected pCREB signaling in the migrating epidermis. Scale bar, 400 μm.
(N) qRT-PCR analysis of the listed genes (n = 4–5/group). All error bars indicate mean ± SEM; *p < 0.05, **p < 0.01, ***p < 0.001.
