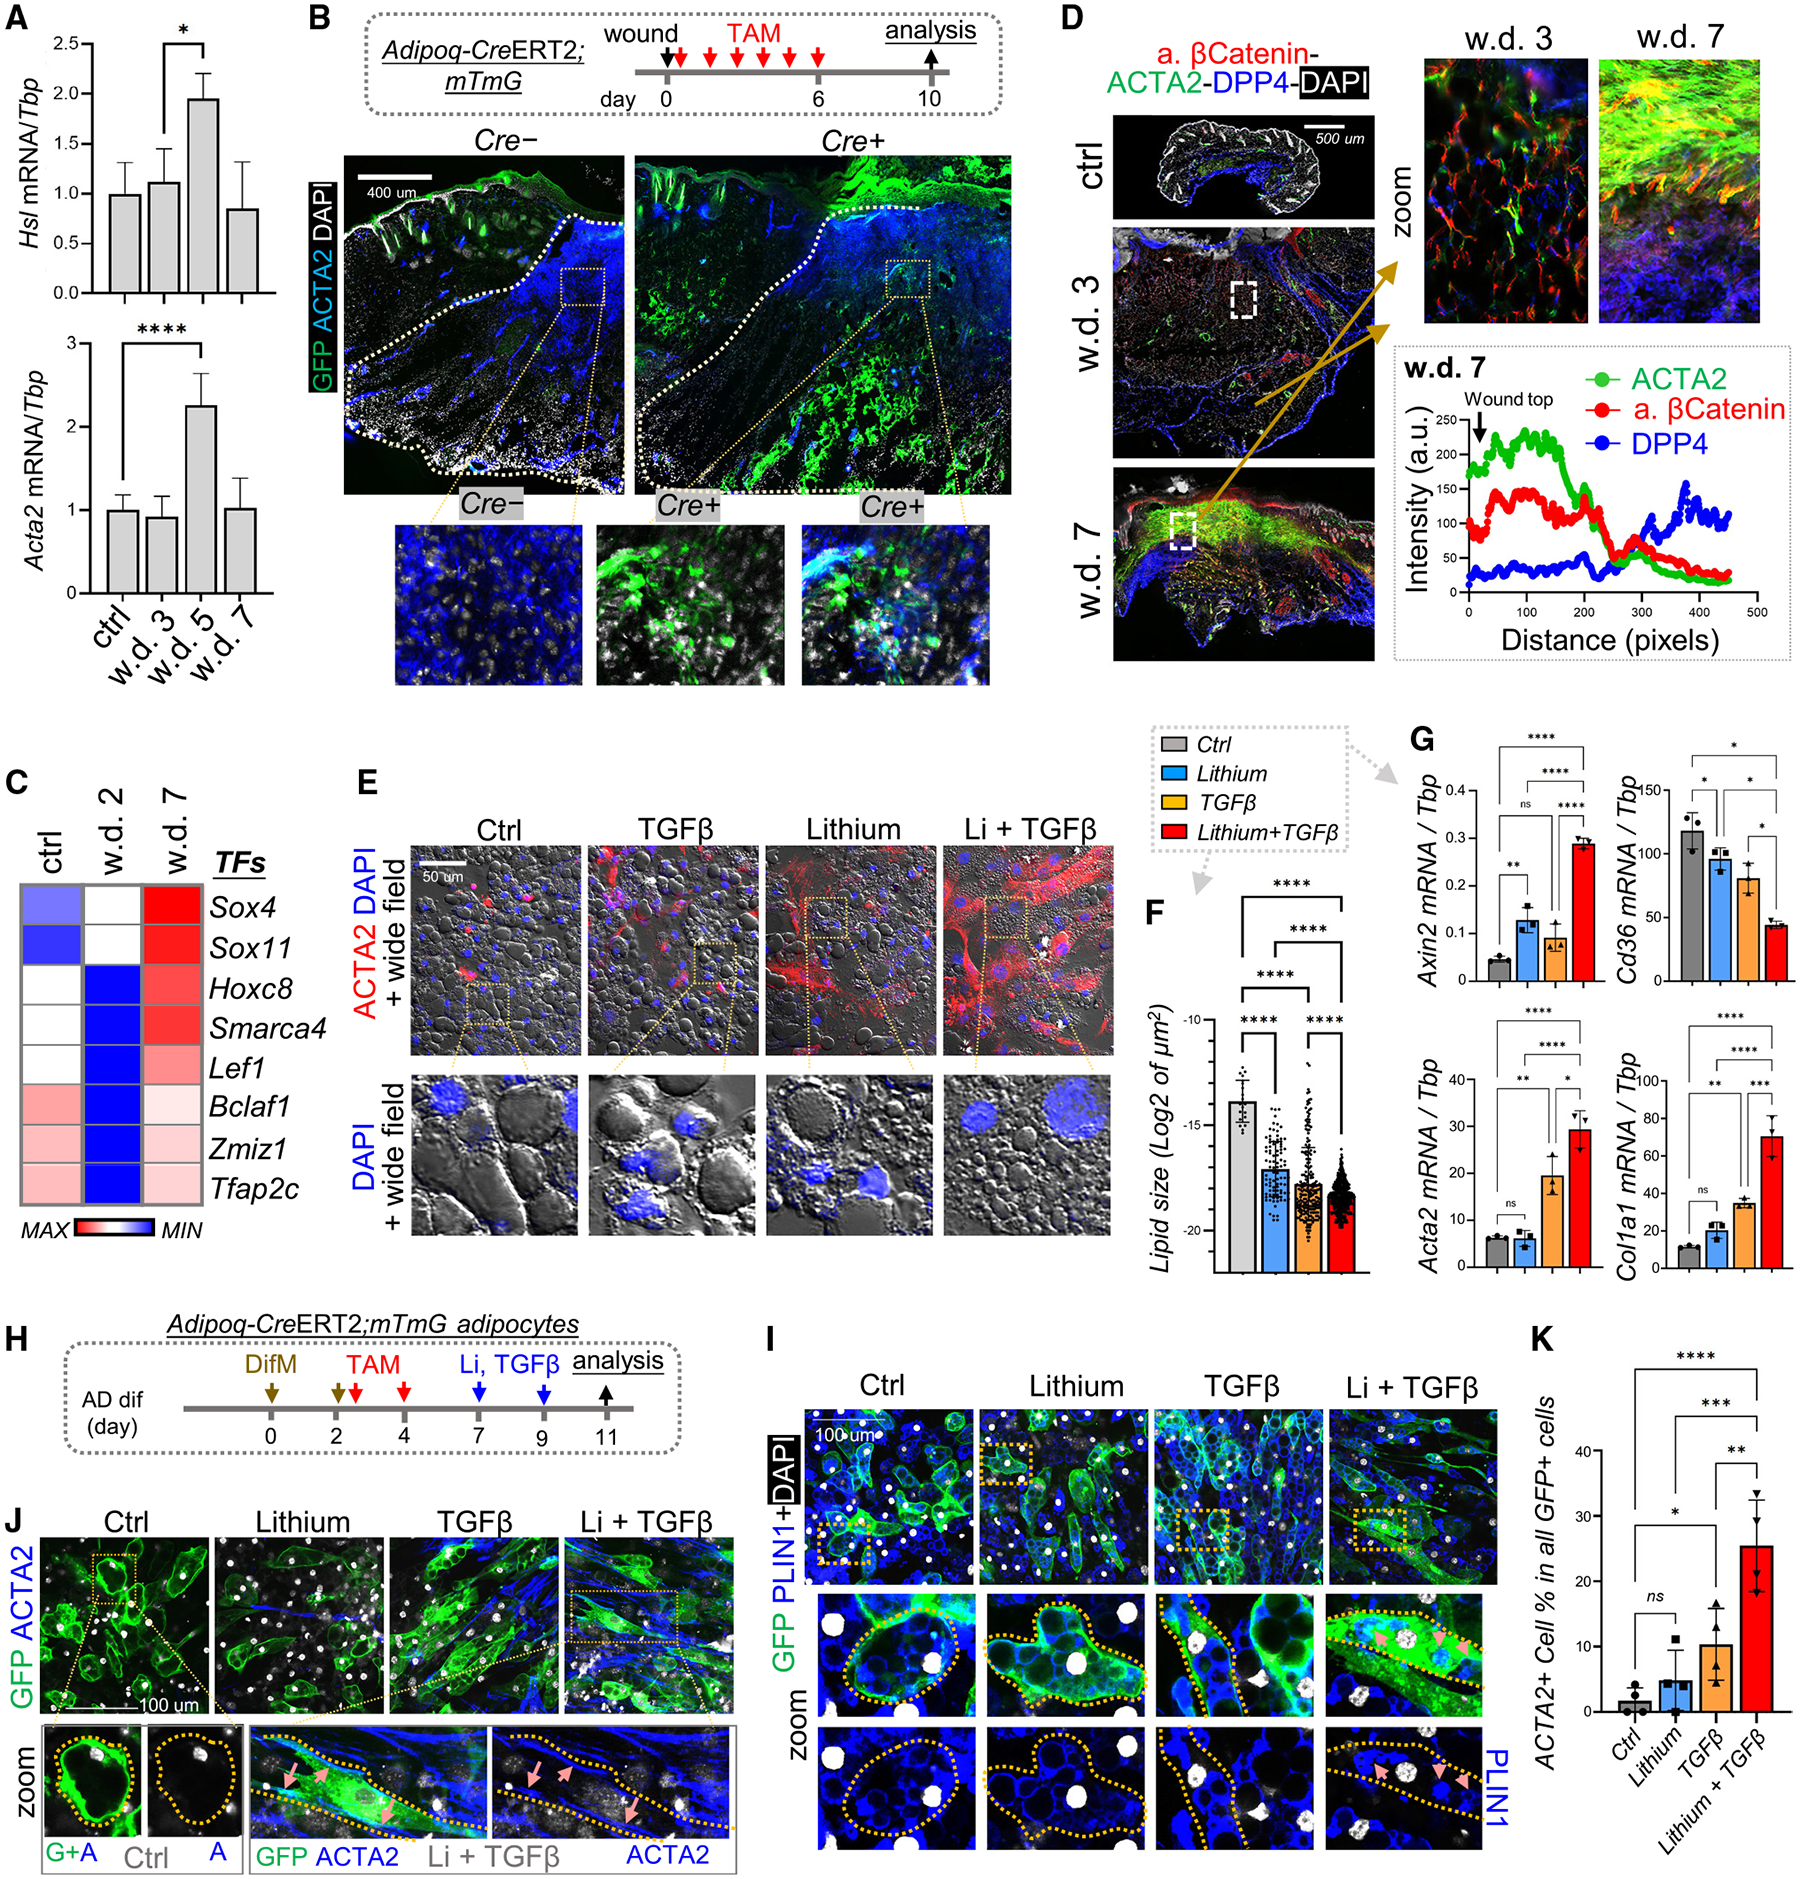
Figure 6. Activation of WNT and TGF-β signaling pathways in adipocyte-lineage cells during the wound-proliferative phase.

(A) qRT-PCR analysis showing the mRNA expression kinetics of listed genes during skin wound healing (n = 3 per group).
(B) Adipoq-CreERT2;mTmG mice were administered tamoxifen (TAM) from day 1 to 6 during wound healing, and wound tissues were collected at w.d. 10 for immunostaining of ACTA2 (blue) and GFP (green). Scale bar, 400 μm.
(C) Heatmap of SCENIC TF analysis showing the top enriched transcriptional factors.
(D) Wound tissues were stained with active β-catenin, ACTA2, and/or DPP4 as indicated. Scale bar, 500 μm. Quantified intensity profiles showing signals from all three fluorescence channels from wound top to bottom (the lower right box) are shown (representative of n = 3/group).
(E–G) Fully differentiated adipocytes were treated with lithium and/or TGF-β2 for 2 days. (E) Immunostaining of ACTA2 (red) and DAPI (blue). Fluorescence and wide-field images were overlaid. Scale bar, 50 μm. (F) Quantification of changes in lipid droplet (LD) size (LD quantified from n = 5 fields/group). (G) qRT-PCR analyses of the indicated genes (n = 3/group).
(H–K) Primary neonatal dFBs isolated from Adipoq-CreERT2;mTmG were differentiated into mature adipocytes in the presence of TAM and then treated with lithium and TGF-β2 (H) before being subjected to immunostaining with the indicated antibodies (I and J) or percentage quantification (K) of ACTA2-expressing myo-FBs in all GFP-positive cells (n = 4/group). Scale bars, 100 μm. All error bars indicate mean ± SEM; *p < 0.05, **p < 0.01, ***p < 0.001.
