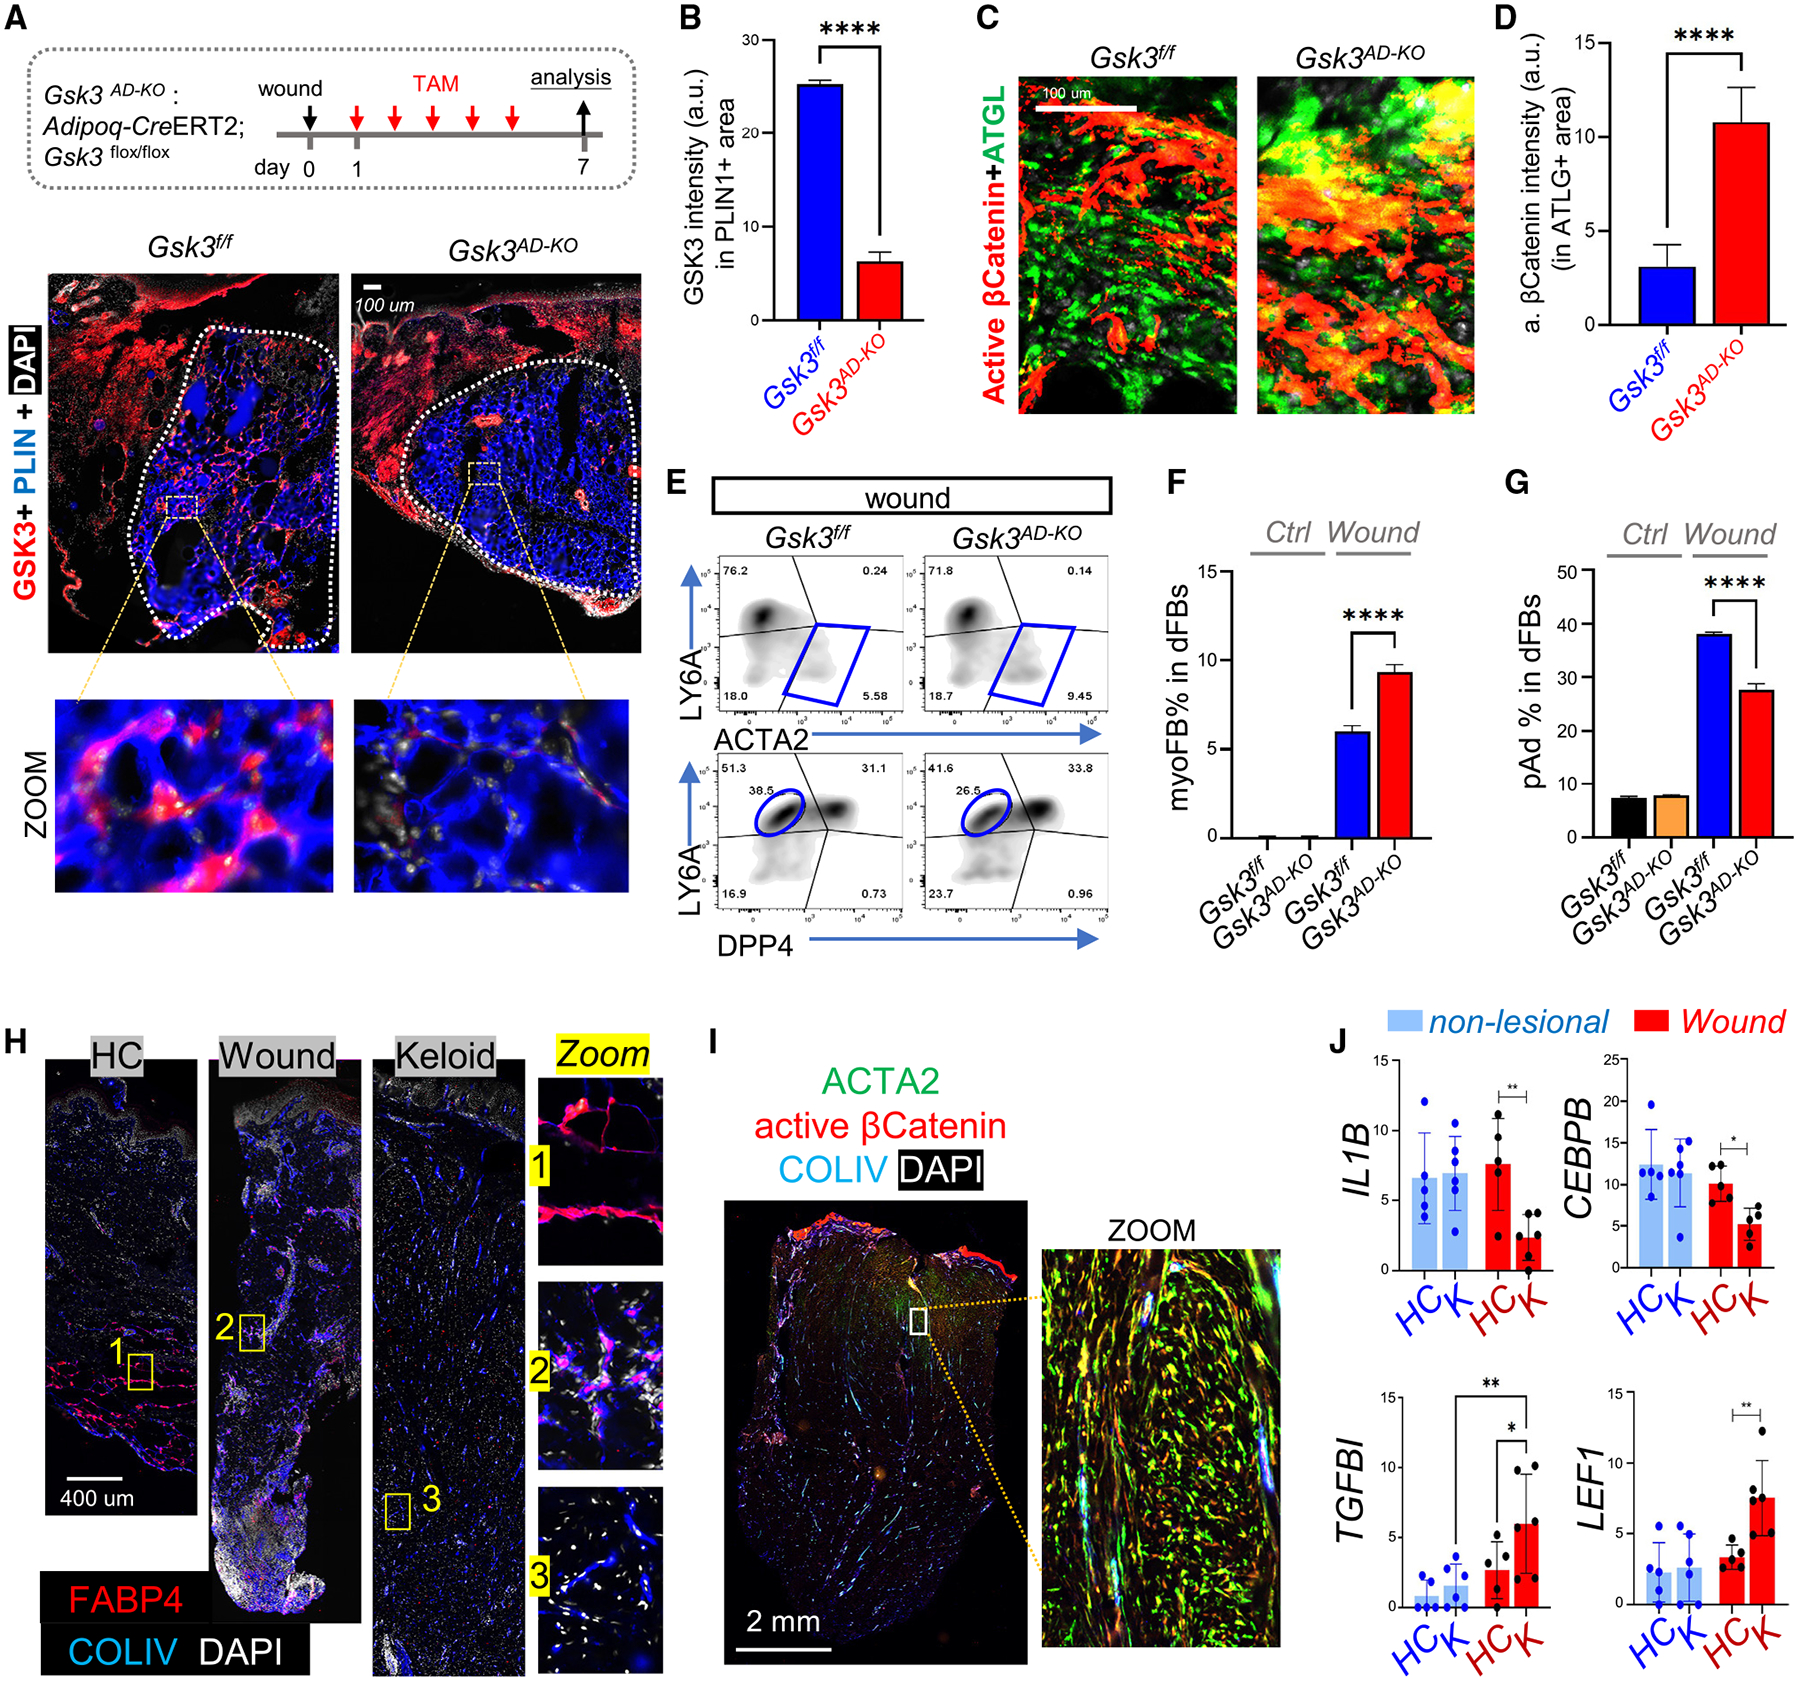
Figure 7. WNT activation in adipocytes promotes myofibroblast formation during wound healing.

(A–G) Adipoq-CreERT2;Gsk3flox/flox mice were administered TAM from w.d. 1 to 6, and w.d. 7 tissues were collected for analysis. (A) Staining of GSK3 (red), PLIN (blue), and DAPI (white), and (B) quantified GSK3 intensity in PLIN1+ cells (n = 4/group). (C) Staining of active β-catenin (red) and ATGL (green) and (D) quantified active β-catenin intensity in ATGL+ area (n = 4/group). Scale bars, 100 μm. (E–G) FACS plots and quantified bar graphs (n = 3/group) showing the percentage of ACTA2+LY6A− myofibroblasts or LY6A+DPP4− preadipocytes in PDGFRA+ dFBs (n = 3/group).
(H) FABP4 (red), COLIV (blue), and DAPI (white) staining in healthy control (HC), wound (day 7), and keloid skin sections. Scale bar, 400 μm.
(I) Active β-catenin (red), COLIV (blue), and ACTA2 (green) staining in keloid skin sections. Scale bar, 2 mm.
(J) Bar graphs showing relative mRNA expression (based on RNA-seq FPKM [fragments per kilobase per million mapped fragments] values) of listed genes in non-lesional and wound tissues from HC or keloid (K) individuals (n = 4–5/group). All error bars indicate mean ± SEM; *p < 0.05, **p < 0.01.
