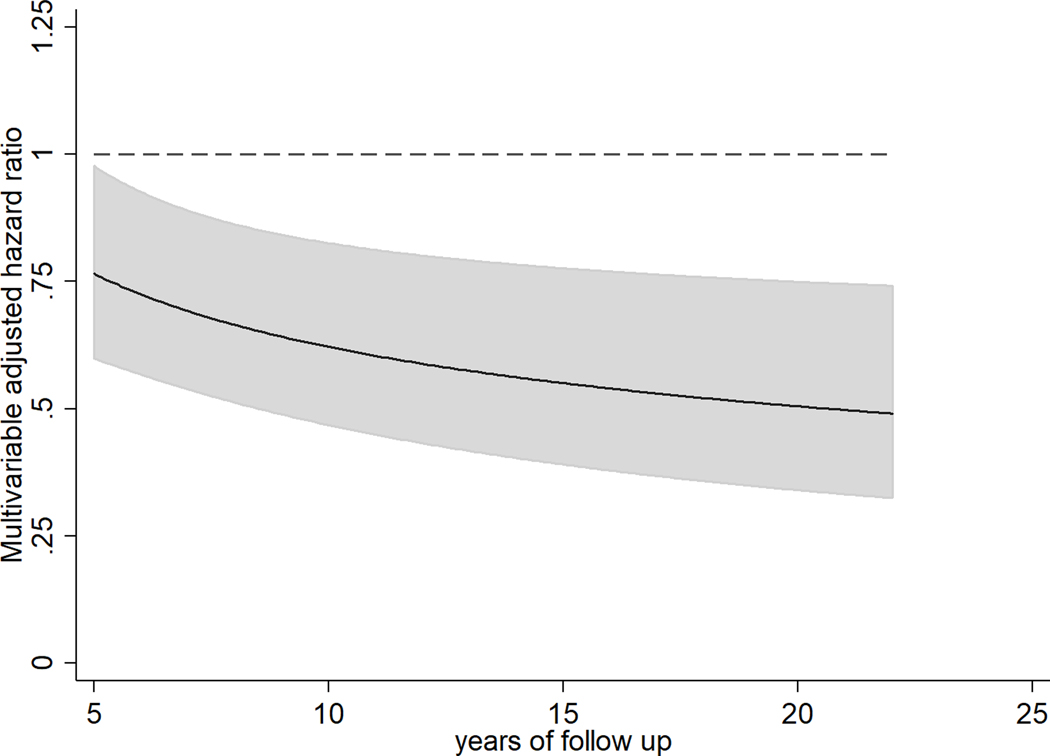
Figure 2. Multivariable-adjusted hazard ratios (and 95% confidence intervals) of total dementia (n=3,564) for 1-IQR unit of circulating AA in older US adults free of dementia and stroke at baseline. Solid lines and shaded area represent the HR estimate and 95% confidence interval overtime, respectively.
Legend: Long-term exposure was assessed by using cumulative average of serial fatty acid measures, i.e., FA levels in 1992 were related to risk from 1992–98; the average of FA levels in 1992 and 1998, to risk from 1998–2005; and the weighted average of FA levels in 1992, 1998, and 2005, to risk after 2005, with 50% weight assigned to the most recent measurement, and 25% assigned to each previous measurement.
The solid line and grey area represent hazard ratios and 95%CI estimated using and , where is the estimated coefficient for 1-IQR unit of AA, and is the estimated coefficient for the multiplicative interaction term (i.e. AA x log(time)), t is years of follow-up, and are estimated variances and covariance for and . Time-varying covariates were updated at each fatty acid measurement.
Multivariable model included adjustment for sex, race (whites or nonwhite), enrollment site (4 sites), education (years of education through 12th grade, any education beyond 12th grade), income (<$12 000, $12 000-$24 999, $25 000-$49 999, or >$50 000/year), APOE status (at least one ε−4, none, unknown), time-varying information on age (years), age-squared, smoking status (never, current or former smokers), alcohol intake (drinks/week), leisure-time physical activity (kcal/week), vegetable (servings/day), fruit intake (servings/day), and a multiplicative interaction term AA as linear variable with log of time.

