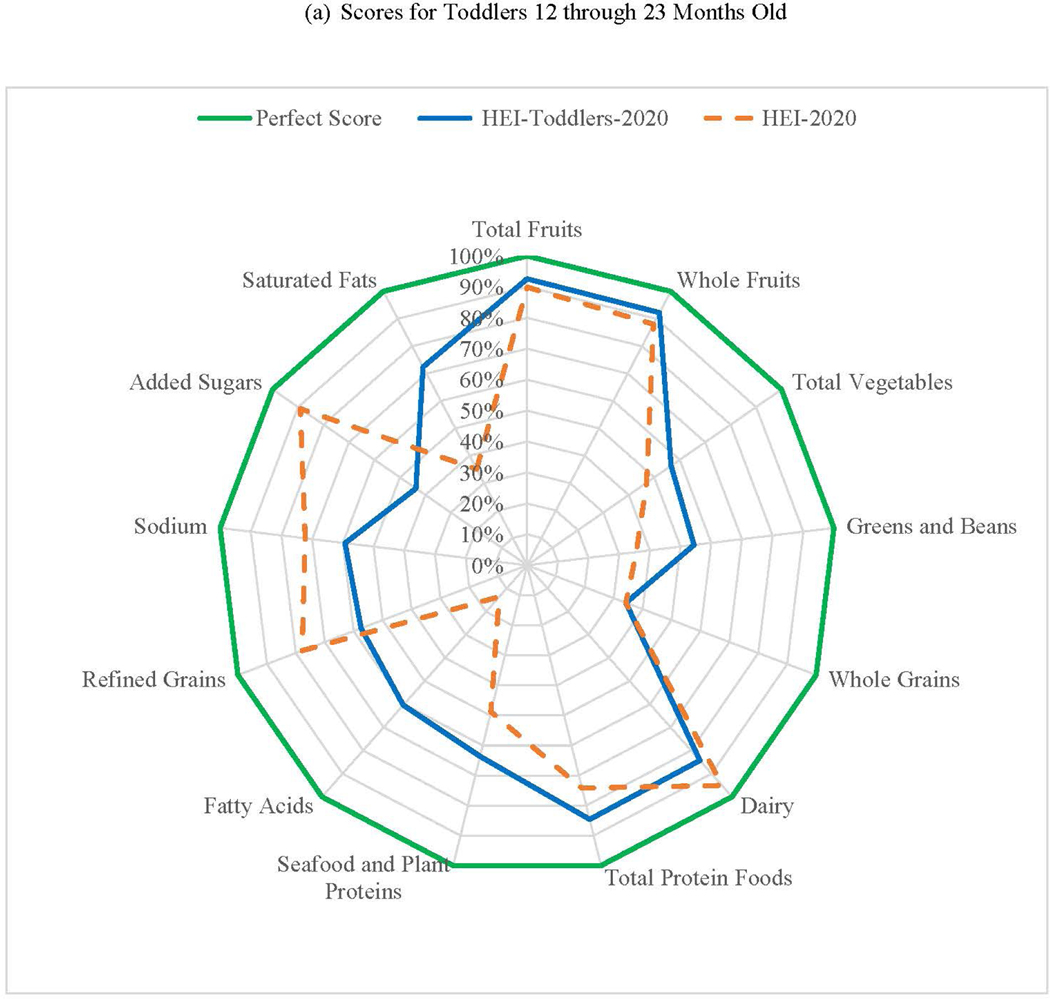
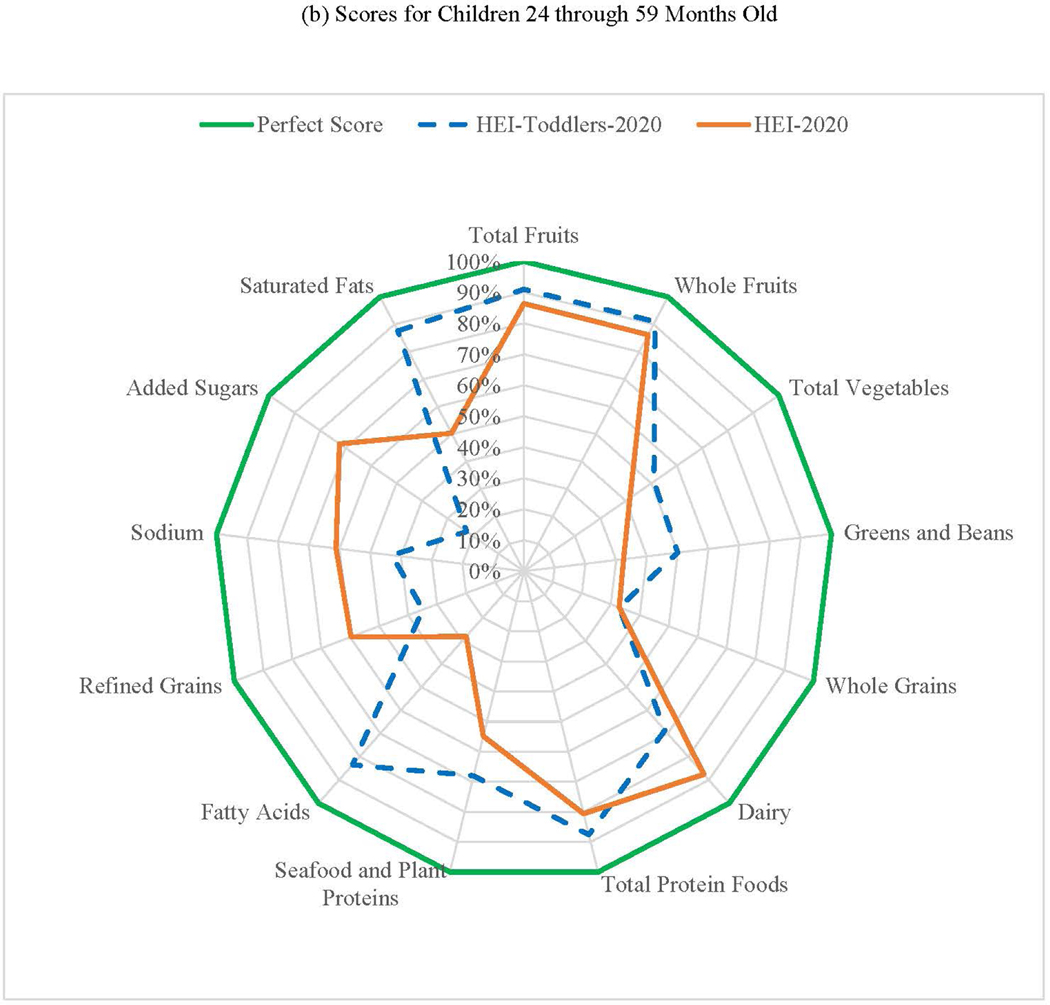
Figure 3.
Differences in Healthy Eating Index (HEI) radar plots by index used, NHANES 2011–2018. (a) HEI Scores of Toddlers 12 through 23 months old, scored with the HEI-Toddlers-2020 index and HEI-2020 index; (b) Children 24 through 59 months old scored with the HEI-Toddlers-2020 index and HEI-2020 index. On the radar plots, each component score is plotted as a percentage of its maximum points on 13 different axes for HEI-Toddlers-2020 and HEI-2020. The outer edge of the “wheel” (or end of the “spoke”) represents 100% of the maximum score for that component; the center represents 0% of the maximum score for any component. Additional information on HEI visualization and radar plots can be found on the NCI website: https://epi.grants.cancer.gov/hei/interpret-visualize-hei-scores.html
Total Scores out of 100 points for (a) Toddlers 12 through 23 months: HEI-Toddlers-2020= 63.4 points; HEI-2020 = 60.9 points; and (b) Children 24 through 59 months old: HEI-2020 = 58.3 points; HEI-Toddlers-2020= 59.2 points.


