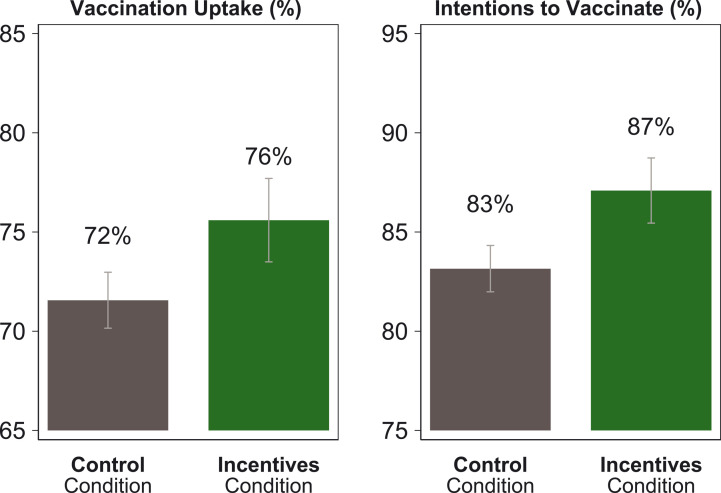
Fig. 1. Vaccination uptake and intentions to get vaccinated, among those in the incentives condition and the control condition.
The graphs show the proportion of participants in the incentives and control conditions who got vaccinated or intended to get vaccinated, on the basis of survey data from the trial linked to Swedish administrative records on vaccination. “Vaccination Uptake” indicates the proportion of participants who got vaccinated within 30 days of the trial, according to vaccination records. “Intentions to Vaccinate” indicates the proportion of participants who intended to get vaccinated within 30 days of the trial, according to experimental data. Error bars represent normal-based 90% confidence intervals (CIs; mean ± 1.64 SE) from OLS regressions with heteroscedasticity-robust standard errors. N = 1131 participants in the incentives condition; N = 2778 participants in the control condition.

