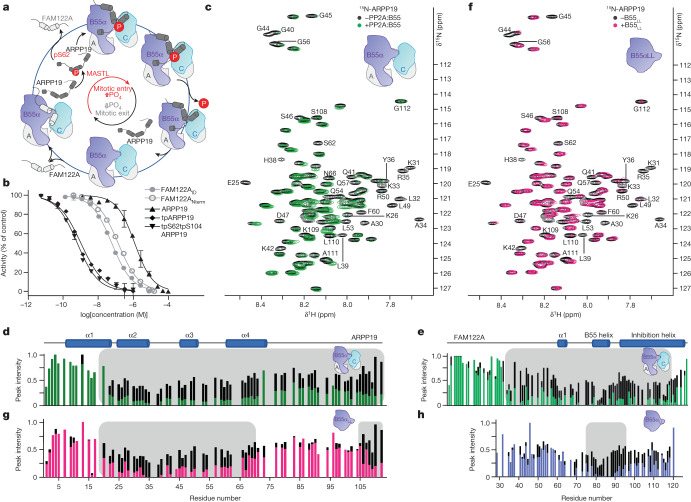
Fig. 1. ARPP19 and FAM122A inhibit PP2A:B55.
a, ARPP19 and FAM122A sequentially inhibit PP2A:B55 activity during mitosis. A, PP2Aa; C, PP2Ac; P, phosphate. b, PP2A:B55 inhibition by ARPP19 (with or without phosphorylation), FAM122ANterm and FAM122AID (mean ± s.d.; n = 3 experimental replicates). Results representative of n = 3 independent experiments. Unpaired two-tailed t-test with 95% confidence interval was used to compare ARPP19 with tpARPP19 (P < 0.0001) or tpS62tpS104ARPP19 (P < 0.0001). IC50 values are reported in Extended Data Table 1. c, 2D 1H,15N HSQC spectrum of 15N-labelled ARPP19 with or without PP2A:B55. d, Plot of peak intensity versus ARPP19 protein sequence for spectra in c; grey shading highlights ARPP19 residues with reduced intensities in the presence of PP2A:B55. Secondary structure elements based on NMR CSI data are indicated. Colour scheme as in c. e, Plot of peak intensity versus FAM122A protein sequence for FAM122ANterm alone (black) and with PP2A:B55 (green); grey shading highlights FAM122A residues with reduced intensities in the presence of PP2A:B55. Secondary structure elements based on NMR CSI data are indicated. f, 2D 1H,15N HSQC spectrum of 15N-labelled ARPP19 with (pink) and without (black) B55LL; grey shading highlights ARPP19 residues with reduced intensities in the presence of B55LL. g, Plot of peak intensity versus ARPP19 protein sequence for spectra in f; grey shading highlights ARPP19 residues with reduced intensities in the presence of B55LL. h, Plot of peak intensity versus FAM122AID protein sequence for FAM122AID alone (black) and with B55LL (blue); grey shading highlights FAM122AID residues with reduced intensities in the presence of B55LL.

