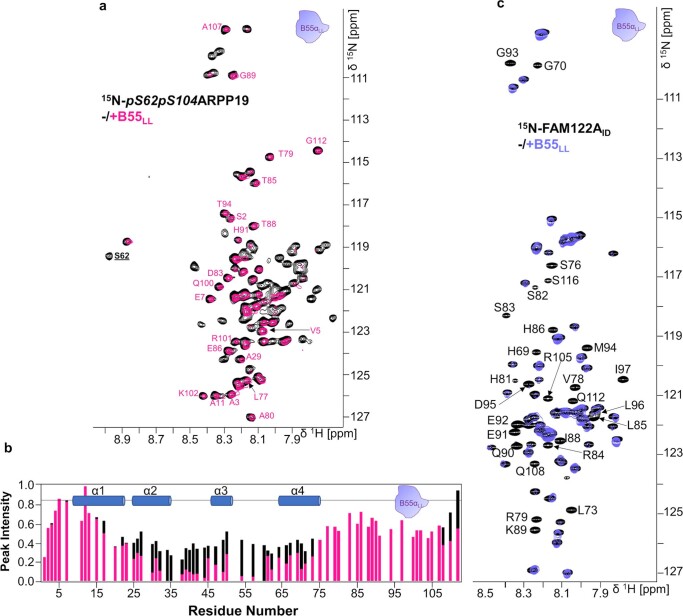
Extended Data Fig. 5. NMR data supporting the interaction of phosphorylated ARPP19 and FAM122A with B55LL.
a. 2D [1H,15N] HSQC spectrum of 15N-labeled pS62pS104ARPP19 alone (black) and in complex with B55LL (pink). pS62 labeled for clarity. b. Peak intensity vs ARPP19 protein sequence plot for pS62pS104ARPP19 alone (black) and when bound to B55LL (pink). Secondary structure elements based on NMR CSI data are indicated. c. 2D [1H,15N] HSQC spectrum of 15N-labeled FAM122AID alone (black) and in complex with B55LL (purple).

