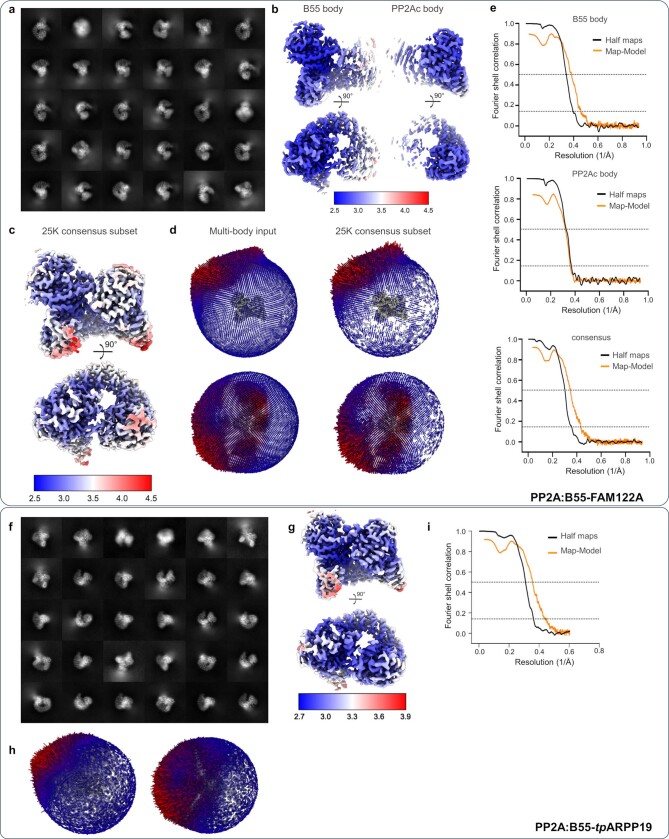
Extended Data Fig. 8. Cryo-EM 2D class averages and maps for PP2A:B55-inhibitor complexes.
a-e, PP2A:B55-FAM122A; f-i, PP2A:B55-tpARPP19. a. Reference-free 2D class averages generated from the 103,522 particles used in the final multi-body refinement. b. The multi-body refinement results for each body, B55 and PP2Ac, colored by local resolution. c. The 25,000-particle subset consensus map, colored by local resolution. d. Histograms of the particle pose angular distribution from the input to the final multi-body refinement (left) and the 25,000-particle consensus subset refinement (right). e. The Fourier shell correlation (FSC) for the independently refined half-maps (black) and the full map and atomic model (orange) for the multibody refinement results (B55 body, top, PP2Ac body, middle) and the 25,000-particle subset consensus (bottom). The “gold standard” half-maps FSC was calculated and corrected for masking effects using Relion; the map-model FSC was calculated by PHENIX using a mask around the model based on map resolution. The FSC = 0.5 and 0.143 thresholds are marked by dashed lines. For the B55 and PP2Ac multibody refinements, the half-maps FSC crosses the 0.143 threshold at 2.55 Å and 2.69 resolution, respectively, and the map-model FSC crosses the 0.5 threshold at 2.61 Å and 3.12 Å resolution, respectively. For the subset consensus refinement, the half-maps FSC crosses the 0.143 threshold at 2.8 Å resolution and the map-model FSC crosses the 0.5 threshold at 2.86 Å resolution. f. Reference-free 2D class averages generated from the 52,934 particles used in the final refinement. g. Cryo-EM map, colored by local resolution. h. Histograms of the particle pose angular distribution from the input to the final refinement. i. The Fourier shell correlation (FSC) for the refinement results. The “gold standard” half-maps FSC was calculated and corrected for masking effects using Relion; the map-model FSC was calculated by PHENIX using a mask around the model based on map resolution. The FSC = 0.5 and 0.143 thresholds are marked by dashed lines. For the refinement, the half-maps FSC crosses the 0.143 threshold at 2.77 Å resolution and the map-model FSC crosses the 0.5 threshold at 2.81 Å resolution.

