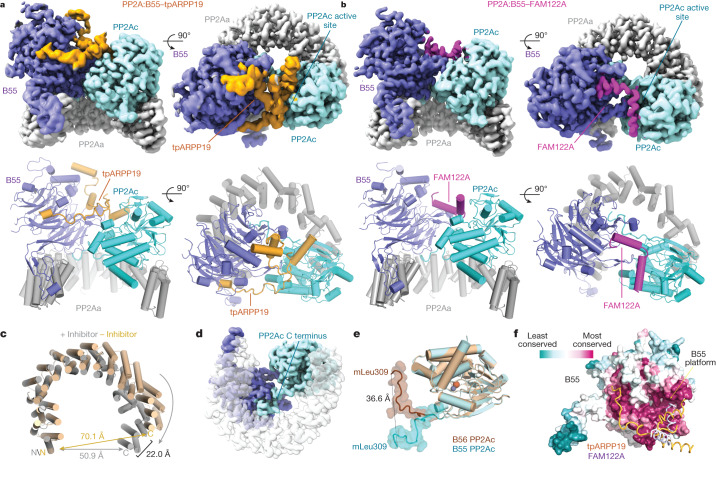
Fig. 2. Structures of the PP2A:B55–tpARPP19 and PP2A:B55–FAM122A complexes.
a, Cryo-EM map and model of PP2A:B55–tpARPP19. Two views of the map (top) with the corresponding view of the molecular model (bottom). b, Cryo-EM map and model of PP2A:B55–FAM122A. c, Overlay of PP2Aa from the PP2A:B55 crystal structure (PDB ID: 3DW8; beige) and the PP2A:B55–inhibitor model (grey), superimposed using HEAT repeats 1–6. d, Rotated view of the experimental map. e, Overlay of the PP2Ac catalytic domains from PP2A:B55-FAM122A (cyan) and PP2A:B56 (brown; PDB ID: 2IAE); the C-terminal tails (amino acids R294–mL309) shown as surfaces. f, B55 shown as surface and coloured by sequence conservation; ARPP19 (orange) and FAM122A (slate blue) are shown as ribbons.

