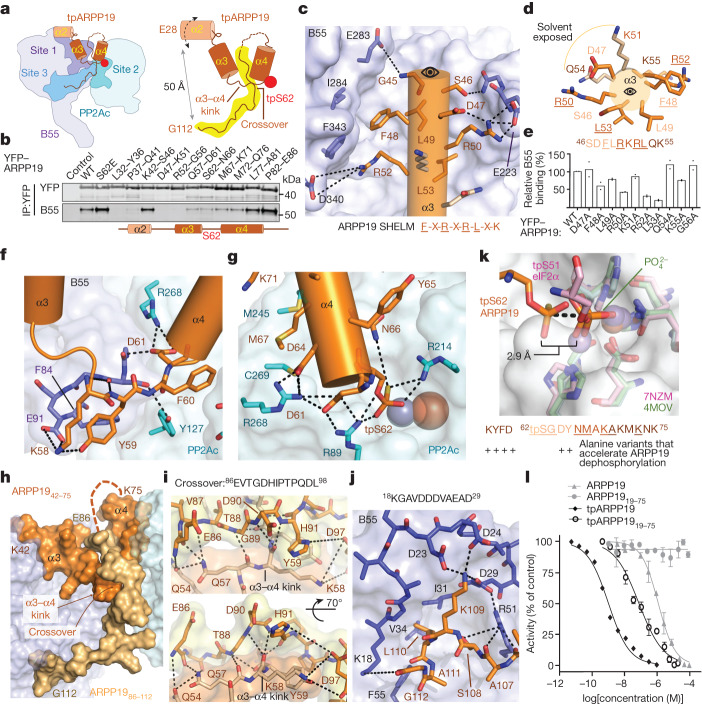
Fig. 3. tpARPP19 inhibition of PP2A:B55.
a, Cartoon of PP2A:B55–tpARPP19 with interaction sites labelled. b, 5-Ala mutational scan of ARPP19 L32–E86. YFP–ARPP19 variants were transfected into HeLa cells, immunopurified and B55 binding was determined by western blot (n = 2). ARPP19 α-helices shown as a cartoon. c, Interaction of helix α3 (orange) with B55 (lavender). ARPP19 binding SHELM shown below. d, Helix α3 helical wheel. B55-binding residues are in dark orange and solvent-exposed residues are in light orange. Label colours indicate residues in the same helical turn; B55-binding residues are underlined. e, Quantification of 1-Ala mutational scan of helix α3 (pull-down experiments performed as in a; n = 2). f, The ARPP19 α3–α4 kink. g, tpS62 at the PP2Ac active site. h, The ARPP19 crossover. Helices α3 and α4 are in orange; the remaining residues are in gold. i, The ARPP19 crossover. Intramolecular contacts are shown as dashed lines. j, ARPP19 binds B55 loop 18KGAVDDDVAEAD29. k, PPP active site overlay of PP2A:B55–tpARPP19. PP1 phosphate (PDB ID 4MOV; PP1, green) and a pre-dephosphorylation complex (PDB ID 7NZM; tpS51eIF2α, pink; PP1, light pink) are shown. tpARPP19 is in orange, PP2Ac is cyan. Bottom, residues that when mutated result in faster dephosphorylation of S6215. l, PP2A:B55 inhibition by ARPP19 variants (with or without phosphorylation; mean ± s.d.; n = 3 experimental replicates). Results representative of n = 3 independent experiments. Unpaired two-tailed t-test with 95% confidence interval was used to compare ARPP19 with tpARPP1919–75 (P < 0.0001) and tpARPP19 with tpARPP1919–75 (P = 0.0002). IC50 values are reported in Extended Data Table 1.

