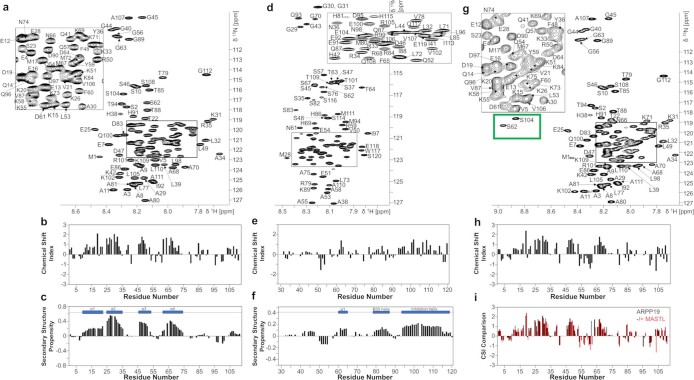
Extended Data Fig. 3. HSQC and CSI plots of ARPP19, FAM122A and MASTL-phosphorylated ARPP19.
a. Fully annotated 2D [1H,15N] HSQC spectrum of 15N-labeled ARPP19. b. Chemical Shift Index (CSI) and c. Secondary-structure propensity (SSP) data for ARPP19 plotted vs. residue numbers. (SSP > 0, α helix; SSP < 0, β strand). Cα and Cβ chemical shifts were used to create the CSI and SSP plots (RefDB database62). Preferred secondary structure indicated above SSP data. d. Fully annotated 2D [1H,15N] HSQC spectrum of 15N-labeled FAM122AID. e. CSI and f. SSP data for FAM122AID plotted vs. residue numbers; same as c. g. Fully annotated 2D [1H,15N] HSQC spectrum of 15N-labeled tpS62tpS104ARPP19. h. CSI; same as c. i. CSI comparison between ARPP19 (black) and tpS62tpS104ARPP19 (red).

