Figure 2.
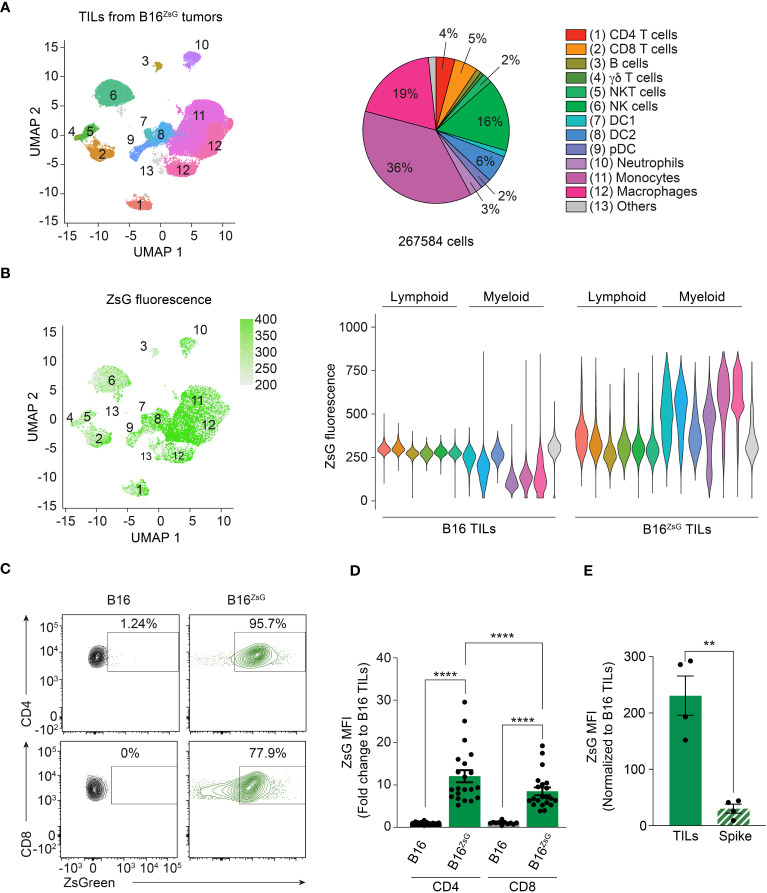
CD4 and CD8 T cells participate in the intracellular transfer. (A) UMAP visualization of flow cytometry data with a pie chart representation of TIL population abundance in B16ZsG tumors. (B) UMAP plot (left) and violin plots (right) of ZsG intensity in each population from B16 and B16ZsG tumors. (C) Representative flow cytometry analysis showing ZsG transfer into CD4 and CD8 T cells from B16ZsG tumors. (D) Summary graph of ZsG MFI in CD4 and CD8 TILs from B16ZsG tumors presented as a fold change relative to B16 tumors. (E) Summary graph of ZsG MFI in intratumorally injected CD45.1 “spike” CD8 T cells in comparison to endogenous CD45.2 CD8 TILs from B16ZsG tumors. (D, E) Mean ± s.e.m, Mann-Whitney U test between B16 TILs and B16ZsG TILs and Wilcoxon test between CD4 and CD8 B16ZsG TILs (D), paired T-test (E): **p<0.01, ****p<0.0001. Data represent three independent experiments (A–C) or are pooled from at least three independent experiments (D, E).

